The FDA is warning people with diabetes and the public that noninvasive smartwatches or smart rings that do not pierce the skin should not be used to measure blood glucose, according to a press release.
The FDA issued a new safety communication on Feb. 21 to inform people with diabetes that glucose readings taken with smart devices that do not pierce the skin could be inaccurate. Those inaccurate measurements could lead a person to take the wrong dose of insulin or a diabetes medication and precipitate dangerously low glucose levels, which could result in mental confusion, coma or death within hours of the error.
The FDA is warning the public that smartwatches and smart rings that do not pierce the skin should not be used for measuring blood glucose.
The FDA has not authorized, cleared or approved any noninvasive smartwatch or smart ring for the measurement of glucose. While those devices claim to use noninvasive techniques to measure blood glucose, the FDA said the devices do not test blood glucose directly. The agency said standalone smartwatches or smart rings are different from smartwatch applications that display data from an FDA-approved device that measures blood glucose by piercing the skin, such as a continuous glucose monitoring device. The FDA’s safety communication applies to devices manufactured by dozens of companies and sold under multiple brand names.
Consumers, people with diabetes and their caregivers are advised not to purchase or use smartwatches or smart rings that claim to measure glucose levels on their own. People with diabetes are advised to speak with their health care provider about using an appropriate FDA-approved device. Providers are advised to warn patients about the risks of using unauthorized blood glucose measuring devices and to help patients select an FDA-approved device if needed.
Neurologic damage following acute viral infections may be attributed to an excessive immune response to the infection, according to a new study.
Many viral infections that don’t directly infect the central nervous system (CNS) have been associated with severe neurologic disease. For these viruses, including newer viruses such as SARS-CoV-2 and Zika, the mechanism behind the association is poorly understood. To gain a better picture of how viruses may cause neurologic disease, researchers used a mouse model of Zika virus infection and identified a population of T cells that may be responsible for the damage.
“Our study ultimately finds that it isn’t the virus itself alone that causes the damage. Instead, we find that it’s a very excessive immune response to the virus,” study author Elizabeth Balint, a PhD student at McMaster University in Hamilton, Ontario, Canada, told Medscape Medical News. Balint’s research could serve as the first step toward eventually developing targeted therapies to prevent neurologic damage.
Cytotoxic T Cells
Traditionally, experts have thought that a high viral load results in more severe damage to the CNS. But surprisingly, the investigators found that the viral load did not correspond with the severity of neurologic damage. This finding suggests that a dysregulated immune response is likely at fault.
The researchers then identified a specific population of cytotoxic T cells called CD8+ T cells that became overactivated during the infection and likely caused the damage. T cells are generally thought to be antigen-specific immune cells that only attack certain pathogens. “What we found, which was quite surprising, was that there were a number of T cells that seem to be nonspecifically activated,” said Balint. The T cells appeared to be activated by a nonspecific receptor during a cytokine storm. “Lots of inflammation leads to excessive T cell activation, and then those T cells are what we’re calling ‘bystander activated’ and able to kill nonspecifically,” explained Balint.
The investigators chose to model Zika because of its status as an emerging virus that was linked to severe neurologic outcomes during the 2015-2016 epidemic. The disease is still circulating, and the mechanism for this association is poorly understood, said Balint. While the findings have yet to be tested in other models, Balint believes they may apply to viruses beyond Zika. She hopes to test other models in the future.
Specific Treatments
With a better understanding of the basic science behind how viral infections cause neurologic damage, researchers may be able to begin developing therapies to prevent and treat disease. “We’re really hoping that the more that we know about these T cells, the more specific treatments we can develop,” said Balint.
In the study, for example, the investigators experimented with an antibody that blocked a particular receptor called NKG2D to avoid activating the cytotoxic T cells. The antibody reduced cell death and prevented Zika-associated paralysis in the mice that received treatment. This antibody has been tested in clinical trials for other uses, such as for the treatment of Crohn’s disease, according to Balint.
She acknowledged that the research is in the early stages for such clinical implications but added that “it does show some promise for developing more targeted therapies.”
Difficult to Isolate
Commenting on the study for Medscape Medical News, Karl Weiss, MD, a professor of medicine at McGill University and chief of infectious diseases at Jewish General Hospital, Montreal, Quebec, Canada, said that the study advances basic science but may or may not produce applications for treatment in future research.
“In the past, whenever we tried to isolate one single element of a very complex immune system,” said Weiss, “we never were able to isolate the culprits very effectively.” That’s because the immune system includes many connected pathways and redundancies in case of failure. “If we find a way of blocking this pathway, we will prevent neurologic problems. The problem with this is that you might block this pathway, but there is probably an alternative.”
Preventing neurologic damage is an important goal, Weiss said. But because of these complexities, the research is still far from the development of any drug. Applying the science in clinical trials is a crucial next step and often the sticking point where potential treatments fail. Weiss also noted that further research using other viruses and models is needed before the findings can be generalized beyond Zika.
When considering clinical implications, Weiss said, “I think we have to be very prudent.”
Fruits are a delicious and healthy way to get essential vitamins and minerals into your diet. However, many people are unsure about whether they should eat fruits before or after meals. In this article, we will explore the benefits of eating fruits before or after meals.
Eating Fruits Before Meals
One of the benefits of eating fruits before meals is that they can help to stimulate digestion. Fruits are high in fiber, water, and natural sugars that can help to get your digestive system moving. Eating fruits before meals can also help to reduce your appetite, which can help you to eat less during your meal.
Another benefit of eating fruits before meals is that they can help to stabilize blood sugar levels. Fruits are high in natural sugars that can be quickly absorbed by the body. When you eat fruits before a meal, the natural sugars in the fruits can help to prevent blood sugar spikes and crashes that can occur after eating a meal.
Eating Fruits After Meals
Eating fruits after meals can also have its benefits. One benefit is that fruits can help to satisfy your sweet tooth. If you have a craving for something sweet after your meal, eating a piece of fruit can be a healthy and satisfying way to satisfy your cravings without consuming too many calories.
Another benefit of eating fruits after meals is that they can help to improve digestion. Fruits are high in fiber, which can help to promote regular bowel movements and prevent constipation. Eating fruits after a meal can also help to promote the growth of good bacteria in the gut, which can improve overall digestive health.
So, Which is Better?
Both eating fruits before or after meals have their benefits. The best time to eat fruits depends on your personal preference and your nutritional goals. If you are looking to stimulate digestion and reduce your appetite, eating fruits before meals may be the best option for you. If you are looking to satisfy your sweet tooth and promote healthy digestion, eating fruits after meals may be the best option for you.
It is important to note that eating fruits at any time of the day is a healthy choice. Fruits are packed with essential vitamins, minerals, and antioxidants that can help to improve overall health and prevent chronic diseases. However, it is important to consume fruits in moderation as they are also high in natural sugars that can contribute to weight gain if consumed in excess.
In conclusion, whether you choose to eat fruits before or after meals, incorporating fruits into your daily diet is a healthy choice. Fruits can provide a variety of health benefits and are a delicious and convenient way to get essential nutrients into your diet.
Nia Imara: My being an artist very much affects my view of the world. And it bleeds into everything, including my science. For me, science is about the search from the outside in. Whereas art is the search from the inside out. One of the connections between art and science is storytelling. One of the outstanding mysteries of star formation is how stellar nurseries are born and how they evolve. I’m Dr. Nia Imara.
I’m an astrophysicist and an artist and this is how stars are born. Stellar nurseries are incredibly complex, and they have this beautiful, intricate structure weaving throughout them. We know that that structure is intimately tied to the birth of stars. But how that structure itself forms and evolves is still a mystery. Stellar nurseries are enormous. They have tens of thousands of solar masses’ worth of gas and dust.
And they stretch for tens, if not hundreds of light-years across. When you look toward the constellation of Orion, just below the belt and stretching above the belt are two of the closest stellar nurseries to us. The Orion stellar nurseries are just about 1,400 lightyears away, which is just our backyard for astronomers.
The Orions are two of the largest, most massive stellar nurseries, and that’s the closest region of massive star formation. A star is born when vast regions of interstellar gas and dust come together over the course of millions of years. Eventually, some regions within those clouds of gas and dust undergo gravitational collapse, becoming so dense that eventually nuclear fusion kicks in. And when that happens, a star is born.
I once did a sketch of myself touching a star, and several years later, I was reading something about 3D printing. Well, part of the challenge with astronomy is that images are inherently flat. Much of that information is collapsed onto one plane. When we’re dealing with structures that are much more complicated than spheres like stars and planets, it can become really challenging to interpret what’s going on. And so it’s really important for us to find clever ways to be able to visualize the structure of stellar nurseries. 3-D models uniquely tap into the human brain’s ability to detect patterns. And so that was the idea behind the 3D printing was to have a new way of visualizing stellar nurseries — visual.
These sorts of visualizations don’t have to compete with our traditional images. It’s just a new way seeing things and hopefully thinking about things. Each of these prints represents a stellar nursery that may be tens or even 100 light-years across. The white material represents the dense gas, the filaments, where the stars are going to be born, and the clear material represents the voids of interstellar space. Each of the prints is about the size of a softball, consisting of thousands of layers, each thinner than a piece of paper.
Now, most astronomers hate dust; dust can dim the light from background stars and galaxies that we’re trying to observe. But I love dust. Stellar nurseries are dusty. And we can use our knowledge of dust to understand the structure of molecular clouds. Stellar nurseries are threaded by these long, dense noodlelike structures called filaments. Embedded within filaments are these compact knots of gas called cores — the final stage before star formation. My collaborators and I ran several computer simulations, nine in total, each representing different physical extremes. So one simulation might have had stronger gravity; another simulation might have had stronger or weaker magnetic fields.
And the whole idea here was to be able to get a sense of how the different physics operating in interstellar space shape the environment of stellar nurseries that eventually go on to form stars. And really, one of the most challenging parts of this research is getting the computer simulations right. We’re able to get a much better understanding of the physics that shaping star formation.
The link between humanity and the cosmos: we literally come from the stars. That means we have a common origin, a common destiny. And when you really think about it, we’re all responsible for each other. The link between art and science for me is my love of color and my love of light. When I think about how Black and brown people have been making major contributions to the sciences and the arts for millennia, I think about people like Benjamin Banneker, George Washington Carver, brilliant scientists and artists who served people with their science and really changed how people think about what a scientist is and what a scientist can be.
Objective Early disease prediction is challenging in acute pancreatitis (AP). Here, we prospectively investigate whether the microbiome predicts severity of AP (Pancreatitis—Microbiome As Predictor of Severity; P-MAPS) early at hospital admission.
Design Buccal and rectal microbial swabs were collected from 424 patients with AP within 72 hours of hospital admission in 15 European centres. All samples were sequenced by full-length 16S rRNA and metagenomic sequencing using Oxford Nanopore Technologies. Primary endpoint was the association of the orointestinal microbiome with the revised Atlanta classification (RAC). Secondary endpoints were mortality, length of hospital stay and severity (organ failure >48 hours and/or occurrence of pancreatic collections requiring intervention) as post hoc analysis. Multivariate analysis was conducted from normalised microbial and corresponding clinical data to build classifiers for predicting severity. For functional profiling, gene set enrichment analysis (GSEA) was performed and normalised enrichment scores calculated.
Results After data processing, 411 buccal and 391 rectal samples were analysed. The intestinal microbiome significantly differed for the RAC (Bray-Curtis, p value=0.009), mortality (Bray-Curtis, p value 0.006), length of hospital stay (Bray-Curtis, p=0.009) and severity (Bray-Curtis, p value=0.008). A classifier for severity with 16 different species and systemic inflammatory response syndrome achieved an area under the receiving operating characteristic (AUROC) of 85%, a positive predictive value of 67% and a negative predictive value of 94% outperforming established severity scores. GSEA revealed functional pathway units suggesting elevated short-chain fatty acid (SCFA) production in severe AP.
Conclusions The orointestinal microbiome predicts clinical hallmark features of AP, and SCFAs may be used for future diagnostic and therapeutic concepts.
WHAT IS ALREADY KNOWN ON THIS TOPIC
The intestinal microbiome is altered in patients with acute pancreatitis (AP) compared with healthy controls.
Early prediction of disease severity in AP is challenging and often requires longitudinal data assessment.
WHAT THIS STUDY ADDS
Full-length 16S rRNA and metagenomic sequencing reveals significant alterations of the orointestinal microbiome in patients with AP that are associated with disease severity and clinical hallmark features such as length of hospital stay and mortality.
A classifier with 16 differentially abundant species and systemic inflammatory response syndrome outperforms established severity scores for AP.
All abundant species in severe AP belong to taxonomic families, which are known as common producers of short-chain fatty acids (SCFAs) and functional profiling suggest elevated SCFA production in severe AP.
HOW THIS STUDY MIGHT AFFECT RESEARCH, PRACTICE OR POLICY
Implementation of a fast-track workflow is feasible for rapid, point-of-care microbiome diagnostics for patients with AP in the emergency department.
Our data may explain the failure of SCFA-containing probiotics in a clinical trial of predicted severe AP.
Exploration of microbiome-derived metabolic pathways and metabolites (eg, SCFA) in patients with AP might open new avenues for early and goal-directed treatment approaches.
Introduction
Acute pancreatitis (AP) is a major cause of hospital admission and results in a considerable socioeconomic burden.1 The overall mortality is reported with 2% as most patients experience a mild course of disease. However, 10%–20% develop a moderate to severe course of disease with systemic and local complications. In particular, the combination of infected abdominal necrosis and organ failure such as respiratory, renal or circulatory failure dramatically increases the mortality rate.2–4 Additionally, patients are also at increased risk to die within 90 days after hospital discharge.5 Here, cardiovascular-related deaths contribute equally as AP-related infections. Besides elevated mortality, patients with severe AP experience major morbidity, decreased quality of life, long hospital stays of up to several months and often undergo multiple internal and external drainage procedures.6 7
To implement effective goal-directed and early treatment strategies, it is important to understand the molecular underpinnings of AP that determine the course of disease within the first few hours after hospital admission. Complex scoring systems such as the Ranson Score, APACHE II, Pancreatitis Activity Scoring System (PASS), Harmless Acute Pancreatitis Score (HAPS) and Bedside Index of Severity in Acute Pancreatitis (BISAP) were developed to predict severity of AP.8–11 However, most of these scores are cumbersome to calculate and require longitudinal data assessment, rendering most classifier not feasible for daily clinical routine.12 HAPS and BISAP are easy to assess but also result in unsatisfactory sensitivity and specificity around 70%. Presence or absence of systemic inflammatory response syndrome (SIRS) has also been proposed as marker for individual parameters of severity with a sufficient sensitivity and negative predictive value.13 14 However, persistent SIRS occurs more often during or after persistent organ failure rather than before.13 Thus, novel markers to reliably predict the course of disease early during hospital admission are needed.
Recently, the intriguing bilateral link between pancreatic diseases and the gut microbiome has attracted significant scientific and clinical attention.15 16 To date, it is assumed that bacteria migrate to the pancreas in a retrograde fashion from the small bowel.17 18 Interestingly, it was shown that healthy pancreas and pancreatic tumours harbour their own distinct intra-pancreatic microbiome.17 Moreover, there is growing evidence that the intratumoral microbiome promotes tumour progression by altering the tumorous immune system.17–19
In AP, microbes translocate from the small bowel into pancreatic necrosis depending on activated regulatory T-cells.20 Furthermore, it was postulated that a large proportion of patients suffer from an intestinal condition known as leaky gut that may play an important role in the pathogenesis of AP.21 Here, it is believed that systemic inflammation and hypovolaemia lead to an increased translocation of bacteria from the intestines. In the PROPATRIA trial, Besselink et al aimed to ameliorate severe AP by administering probiotics to patients with predicted severe AP. Notably, the trial had to be discontinued after an interim analysis revealed an increased risk of mortality in the probiotic arm,22 indicating the potential role of intestinal microbiota in the pathogenesis of AP.
To this end, it is not surprising that patients with AP have an altered intestinal microbiome compared with healthy controls.23 24 Furthermore, preliminary studies with less than 60 patients investigated the rectal microbiome as biomarker for a necrotic course of disease and for the occurrence of respiratory distress syndrome.25 26 However, there is a lack of comprehensive prospective clinical data investigating the role of the orointestinal microbiome in AP and its association with clinical hallmark features. Here, we conducted a prospective cohort study enrolling patients with AP from 15 European centres. The oral and rectal microbiome was analysed by full-length 16S rRNA gene and metagenomics sequencing at admission and associated with the revised Atlanta classification (RAC), mortality and length of hospital stay.27
Methods
Recruitment and endpoints
For this European-wide, multicentric, prospective observational cohort study (Pancreatitis—Microbiome as Predictor of Severity; P-MAPS), 450 patients with acute pancreatitis (AP) were recruited from 15 European centres within 72 hours of hospital admission (online supplemental table S1). No transferred patients from other hospitals were included in the study. Sample size was calculated prior enrolment by power calculation (supplementary methods).27 Patients were enrolled between March 2020 and June 2022. AP was diagnosed if two of the following criteria were fulfilled: (1) lipase ≥3 times of the upper limit, (2) characteristic upper abdominal pain, (3) imaging features in line with AP. After informed consent was obtained, buccal and rectal swabs (eSwab, Copan, Brescia, Italy) were collected according to previously published protocols.28 All samples were frozen at −80°C within 1 hour after collection. Frozen swabs were shipped from external centres to University Medical Centre Goettingen on dry ice. Exclusion criteria were patients <18 years, pregnancy and imaging features or clinical signs of chronic pancreatitis. Clinical data of each patient were pseudonymously entered in an online database (SoSci Survey) (figure 1). The study was registered at clinical.trial.gov (NCT04777812). It was not possible to involve patients or the public in the design, or conduct, or reporting or dissemination plans of our study.
Study protocol and study population. (A) Patients with acute pancreatitis (AP) were recruited within 72 hours after hospital admission. Buccal and rectal swabs were stored at −80°C and were shipped on dry ice. Metadata were stored in SoSci Survey. All samples were sequenced using the Oxford Nanopore Technologies (ONT) platform. (B) Study population and negative control overview. Bar plots for (C) aetiologies, (D) body mass index (BMI) and (E) age. ERCP, endoscopic retrograde cholangiopancreatography.
The primary endpoint is the association of the orointestinal microbiome with the RAC. Secondary endpoints are the association of orointestinal, microbiome with mortality, number of intervention and length of hospital stay.27 Metadata for numbers of interventions were insufficiently obtained and thus it was not possible to associate the microbiome with this secondary endpoint. Severity of AP (organ failure >48 hours and/or the occurrence of pancreatic collections that required drainage) was defined as post hoc variable.
DNA extraction, sequencing, classification
A comprehensive wet-bench and bioinformatical workflow for analysing microbiome samples sequenced with Oxford Nanopore Technologies (ONT) was previously published by our group.28 Detailed descriptions are provided in online supplemental methods. All buccal samples underwent full-length 16S rRNA gene sequencing and rectal samples were sequenced with the whole metagenomic approach. The previously established and validated MetaPont pipeline was used to classify microbial data.28 All fastq files were uploaded in Qiita (study ID 15088) and the European Nucleotide Archive (ERP153335) in a per sample manner with their corresponding sample data and prep-data.29 Functional profiling was assessed with DIAMOND and Megan6 Ultimate Edition (online supplemental methods).
Statistical analysis
All subsequent analyses were conducted in R V.4.1.2 or newer. Microbial data preprocessing is described in depth in online supplemental methods. After testing normality with Shapiro-Wilk test and testing homogeneity of variance by applying Levene test, a t-test or Mann-Whitney U test was performed, respectively. For variables with more than two groups, analysis of variance (ANOVA) or Kruskal-Wallis was applied depending on normal distribution. Details about alpha and beta-diversity metrics are implemented in supplementary methods. Whenever feasible, 95% CIs are provided for estimates. Results were regarded as significant with a two-sided p value <0.05. If more than three pairwise groups are compared, p values were adjusted for multiple testing. A detailed description of factoring in confounders is provided in online supplemental materials.
Multivariate analysis
Normalised microbial and corresponding clinical data were used to build classifiers for predicting severity for metagenomically sequenced rectal samples. A matched subgroup of a non-severe AP group was defined (non-severe, severe ratio 2:1) for identifying differential abundant species between severity groups (online supplemental methods). Extended and circumscribed classifiers were built with weighted regularised regression and random forest. More details are provided in online supplemental methods.
Differentially abundant species and SIRS were used to predict severity in a Ridge regression for the whole study population and compared with BISAP and HAPS. All receiver operating characteristics (ROC) for regression models were calculated by using leave-one out cross validation. Area under the receiving operating characteristics (AUROCs) for random forests are based on predicted case probabilities and reported without cross-validation.
Results
Description of study population
In total, 450 patients were prospectively enrolled in the online database SoSci Survey. After revision of metadata 18 patients with signs of chronic pancreatitis (CP) were excluded. Moreover, samples from eight patients went missing during shipment to the University Medical Center Goettingen. To this end, 424 patients with corresponding 419 buccal and 414 rectal samples remained for sequencing (5 buccal and 10 rectal swabs were missing). After normalisation of the microbial data, 411 buccal and 391 rectal samples remained for subsequent analysis (figure 1B). Among eight different causes of AP, biliary was the most common followed by alcohol and idiopathic (figure 1C). Other causes for AP are listed in online supplemental tables S2 and S3. The median body mass index (BMI) was 26.9 kg/m2 (figure 1D) and the median age was 60 years (figure 1E).
RAC is associated with early alterations of rectal microbiome
The RAC is a widely used classification of AP and subsumes three categories (RAC I–III).30 The primary endpoint was associated with buccal and rectal microbiomes by calculating alpha-diversity and beta-diversity. To investigate, whether significant results derived from RACI-III, 79 potential confounding clinical features were factored in (online supplemental figure S1).
Interestingly, we did not observe any significant differences in buccal samples regarding α-diversity and β-diversity (online supplemental figure S2A–D). Accordingly, α-diversity indices were also not significant for rectal samples (online supplemental figure S2E). However, Bray-Curtis distance revealed a different microbial signature of RAC III compared with RAC I and RAC II, respectively (p values RAC I vs III=0.024*, RAC II vs III=0.009**), whereas the latter two almost completely overlapped in PCoA (p value RAC I vs II=1) (figure 2A). Differential abundance calculations with microbiome multivariable association with linear models 2 (MaAsLin2), linear discriminant analysis effect size (LEfSe) and other distance metrics strongly support this finding (figure 2B, online supplemental figure S2F–I). All three RAC subgroups differed regarding seven potential confounding factors (online supplemental table S4A,B). Five of these factors had an impact in microbial composition and thus were included in stratified PERMOANOVA (online supplemental figure S3A–C). However, our results remained highly significant (p value RAC III vs I and II=0.001**) (online supplemental table S5).
Association of rectal microbiome with primary and secondary endpoints. (A) Bray-Curtis distances were plotted in PCoA for rectal samples and were grouped for revised Atlanta classification (RAC I=blue, RAC II=green, RAC III=red). (B) Differential abundances between RAC subgroups were calculated with MaAsLin2 and displayed in bar plots. Rectal samples were associated with mortality with (C) Bray-Curtis distances and (D) differential abundances (alive=light green, dead=orange). (E) The β-diversity distances for rectal microbiome were continuously coloured for length of hospital stay. (F) For differential abundances, a cut-off of 30 days was chosen and patients were grouped accordingly (long stayer ≥30 days=red, short stayer <30 days=blue). P values for β-diversity were calculated by PERMANOVA. Length of hospital stay was rank-transformed for PERMANOVA tests. For MaAsLin2, all potential confounders were included in multivariable testing and species were considered as differentially abundant if q-value <0.25. MaAsLin2, microbiome multivariable association with linear models; PCoA, principal coordinate analysis.
Mortality is associated with early alterations of rectal microbiome
Secondary endpoints were associated with buccal and rectal microbiomes by calculating alpha-diversity and beta-diversity. To investigate whether significant results derived from endpoints, 79 potential confounding clinical features were factored in (online supplemental figure S1).
In total, 10 patients of 424 died within 30 days after AP diagnosis or during the hospital stay. Notably, deceased patients revealed significantly less observed species in rectal (p value=0.041*) but not in buccal samples (p value=0.452) (online supplemental figure S4A,B). Both alpha-diversity metrics that emphasised evenness (Shannon, inverse Simpson index) remained insignificant in buccal and rectal samples (online supplemental figure S4A,B). However, the rectal but not buccal microbiome was significantly different between alive and deceased patients regarding Bray-Curtis distances (p value=0.006**), other beta-diversity indices and differential abundances (figure 2C,D, online supplemental figure S4C–I). Patients who died within 30 days were significantly older (p value=0.026*) and had a lower BMI (p value=0.037*) compared with survivors (online supplemental figure S5A,B). Notably, both groups did not significantly differ regarding other clinical features (online supplemental table S6A,B). Pairwise distance comparison for both groups separately indicated that age and BMI had an impact on microbial composition and thus were incorporated in stratified PERMANOVA test for Bray-Curtis metrics (online supplemental figure S5C,D). However, stratification of PERMANOVA still provided a significant result (p value=0.013*) (online supplemental table S5).
Length of hospital stay is associated with early alterations of rectal microbiome
Before analysing the association of microbial data with length of hospital stay, all deceased patients were excluded. To this end, 401 buccal and 381 rectal samples were included. A weak but significant negative correlation was calculated between alpha-diversity (observed species) and length of hospital stay in buccal and rectal samples (buccal: p value=0.01*, Rho=−0.13, rectal: p value=0.049*, Rho=−0.1), but remained insignificant for Shannon and Inverse Simpson Index (online supplemental figure S6A–F). Bray-Curtis distances showed significant differences in PERMANOVA test (p value=0.009**) for rectal samples (figure 2E). Other beta-diversity metrics for buccal and rectal samples except weighted UniFrac (UF) also showed significant changes (online supplemental figure S7A–F). Differential abundance calculation revealed significant differences of species between short (<30 days) and long hospital duration (≥30 days) (figure 2F, online supplemental figure S7G). We further investigated potential confounding variables (online supplemental table S7A,B; online supplemental figure S8A–K). A stratified PERMANOVA confirmed that Bray-Curtis distances were significant (p value=0.007**) (online supplemental table S5).
Post hoc definition of severe versus non-severe acute pancreatitis
Severe pancreatitis was defined as having persistent organ failure (>48 hours) following AP and/or the occurrence of pancreatic collections that required drainage (figure 3A). This post hoc endpoint was chosen since the majority of Atlanta II patients (n=87) did not require interventional drainage of necrotic collections and could be discharged significantly earlier compared with Atlanta II patients that required interventional drainage (n=6; 13.4 days vs 24.2 days; p=0.003**). Thirty out of 424 patients were considered as severe AP according to these criteria (table 1). After normalisation of microbial data, 29 buccal and 28 rectal samples from severe AP, and 382 buccal and 363 rectal samples for non-severe AP were subsequently analysed (figure 3A). Overall, the 30-day or in-hospital mortality was 2.4%. However, patients with severe AP showed a higher mortality (26.67% vs 0.51 %, p value <0.0001***) compared with the non-severe group (figure 3B). SIRS was defined when two or more of four criteria were present and occurred significantly more often in the severe AP group (p value <0.0001***) (table 1). Established prediction scores like the BISAP and HAPS score significantly higher in the severe group (both p values<0.0001***) (figure 3C,D). Furthermore, patients with severe AP stayed significantly longer in hospital than the non-severe AP group (p value <0.0001***) (figure 3E). Severe AP was also accompanied by more frequent and higher grades of organ failure, more frequent intensive care unit (ICU) admissions, and higher frequencies of necrotic AP and infected collections (table 1).
Association of rectal microbiome data with severity. (A) Definition and sample size of severe (violet) and non-severe (light blue) for buccal and rectal samples. (B) Mortality in severe and non-severe patients. Bar plots showing distributions of severe and non-severe APs regarding (C) BISAP score, (D) HAPS and (E) a violin plot for length of hospital stay. (F) For β-diversity, Bray-Curtis distances are ordinated with PCoA for rectal swabs. PERMANOVA was used to test significance. (G) Differential abundances between non-severe and severe were calculated with MaAsLin2 (including all potential confounding variables q-value <0.25) and displayed in bar plots. BISAP, Bedside Index of Severity in Acute Pancreatitis; HAPS, Harmless Acute Pancreatitis Score; LEfSe, linear discriminant analysis effect size; MaAsLin2, microbiome multivariable association with linear models; PCoA, principal coordinate analysis
Disease severity is associated with microbial shift in rectal microbiome
Three different indices were calculated to obtain α-diversity. All indices did not show any significant differences between groups in buccal and rectal samples (online supplemental figure S9A,B). Regarding β-diversity, Bray-Curtis distance metrics were significantly different between severe and non-severe AP for rectal (p value=0.008**) but not buccal swabs (p value=0.571) (figure 3F, online supplemental figure S10A–C). Notably, these results were confirmed with other β-diversity distance metrics (online supplemental figure S10D–F). Moreover, differential abundances obtained by MaAslin2 and LEfSe revealed several differentially abundant species in both groups (figure 3G, online supplemental figure S10G). It is commonly known that the microbiome is influenced by several host dependent and independent factors.31 Again, we tested whether 79 known clinical features as potential confounding variables have an impact on microbial composition and thus explain the microbial shift more than severity. For severity, both groups did not differ significantly in any potential confounding variable (online supplemental table S8A,B). Notably, severity remained significant in permutated ANOVA for distance-based redundancy analysis (db-RDA) for rectal samples even if ten frequently reported confounding variables were incorporated in db-RDA (p value=0.022*) (online supplemental figure S10H, online supplemental table S9). However, the biplot of db-RDA revealed that vectors of some variables heading in the same or the opposite direction as severity, and thus can bias the PERMANOVA results. To address this issue, we stratified the PERMONOVA test for these variables and yielded a significant difference between severe and non-severe APs (p value=0.013*, online supplemental table S5). Moreover, focusing on R2 values obtained by PERMANOVA test revealed that severity only accounts for a moderate variance compared with other confounding factors like country from where the sample originated (online supplemental figure S11A).
Matched cohorts identify 16 differentially abundant species in severe versus non-severe AP
To identify species that are more directly linked to disease severity, we matched patients based on possible confounding features and then repeated the procedure. To this end, we diminished the influence of potential confounding variables on microbial composition by extracting a subpopulation from the non-severe group that matched with the severe group with a target ratio of 2:1 (figure 4A). The matching was stratified for country, antibiotic intake and gender (online supplemental table S10). After matching rarified samples, 28 severe and 53 non-severe remained for further analysis (25 severe matched to two non-severe, each; three severe matched to one corresponding non-severe, because of stratification). The Bray-Curtis distance remained significant (p value=0.001***) between severe and non-severe AP, and both groups were more separated compared with the whole population (figure 4B). Also, the R2 value of severity increased 10-fold and was the only significant variable in PERMANOVA test besides RAC (online supplemental figure S11B). Taken together, this matched population showed clearer shifts of microbial compositions between severe and non-severe AP than the total study population. Consequently, we calculated differential abundances with this respective cohort. There are several approaches to obtain differential abundances with different underlying statistical approaches.32 33 MaAslin2 is based on generalised linear and mixed model and allows multivariate analysis.34 Here, all potential confounding variables are included in this multivariable analysis. LEfSe is a widely applied method, applicable to rarefied microbial features using non-parametric tests and subsequently linear discriminant analysis (LDA).35 In total, 18 species with MaAsLin2 (q value<0.05) and 51 species with LEfSe (LDA score >2, p value <0.05) were defined as differential abundant. Furthermore, we applied a median abundance filter (figure 4C). Sixteen species had a proportion above this filter of 0.002 in at least one group and were considered as relevant for being included in the circumscribed classifier (figure 4D).
Building classifiers for prediction of severity. (A) The graphical summary describes the modelling process. By using the matchIT package, 53 patients were identified from the non-severe cohort who matched best regarding 79 clinical features. (B) Bray-Curtis distances were calculated for rectal samples of matched population and PERMANOVA test was performed to assess p value. (C) The Venn diagram explains the distribution of differential abundant species obtained by LEfSe (LDA score >2, p value < 0.05), MaAsLin2 (all potential confounders included and q value <0.05) and abundance filter (median proportion 0.002 in at least one group). (D) A heatmap displays the distribution of centred log transformed (CLR) abundances of 16 differential abundant species and clinical parameters in matched study population. An extended (elastic net) and circumscribed (Ridge) model was built for (E) matched cohort and (F) whole study population. The extended model included all 819 rectal species and all 79 potential clinical confounders. For circumscribed model, 16 differential abundant species and SIRS were combined and were compared with BISAP and HAPS. (G) Gene set enrichment analysis (GSEA) of KEEG orthologies (KOs) calculated for KEGG modules revealed functional pathway units which contribute to short-chain fatty acid (SCFA) production (red arrows) more expressed in severe APs (violet). AP, acute pancreatitis; BISAP, Bedside Index of Severity in Acute Pancreatitis; HAPS, Harmless Acute Pancreatitis Score; LEfSe, linear discriminant analysis effect size; LDA, linear discriminant analysis; MaAsLin2, multivariable association with linear models 2.
Sixteen differentially abundant species and SIRS can predict disease severity in AP
To predict severity, an extended and a circumscribed classifier were built with regularised regressions and random forest. First, to assess the concept, we used an extended classifier to predict severity for the matched population. Here, all 819 species and 79 clinical features (metadata) were included in an elastic net regularised regression yielding an AUROC of 77.6% (figure 4E). Further results from regression and random forest extended classifiers are described in the supplementary results (online supplemental table S12A,B). Notably, the extended classifier with all rectal species is able to predict severity. Next, we constructed a circumscribed model with 16 differential abundant species and systemic inflammatory response syndrome (SIRS). SIRS was chosen because of the easy assessment and the known predictive value.13 SIRS alone is not highly sensitive to determine persistent organ failure in AP.36 However, in combination with further clinical features, it is part of established risk scores like BISAP.11 Notably, our combined circumscribed regression approach achieved an AUROC of 87.4% in regression and in random forest 88. 6% (figure 4E, online supplemental table S12A,B). Finally, we rebuild the circumscribed classifiers on the whole study population. Here, the 16 differential abundant species and SIRS (non-severe n=317 and severe n=25) still yielded an AUROC of 84.8% in Ridge regression, outperforming established scores such as BISAP (70.1%) (non-severe n=223 and severe n=23) and HAPS (62.3%) (non-severe n=309 and severe n=24) (figure 4F). AUROC of 16 species was 62.4% and for SIRS alone 77.7% (online supplemental figure S10I). Most remarkably, these 16 differential abundant species and SIRS yielded a positive predictive value of 66.6%, a negative predictive value of 94% and an accuracy of 93.3%. To this end, we conclude that rectal species in combination with SIRS predict severity better than BISAP and HAPS.
Functional profiling identifies SCFA producing pathways in severe AP
Interestingly, all differentially abundant species over-represented in severe AP (Parabacteroides distasonis, Enterocloster bolteae, Dysosmobacter welbionis, Flavonifractor plautii, Lachnospira GAM79, Lachnospiraceae sp., Lachnospira eligens, Roseburia hominis, Anaerobutyricum hallii and Clostridium CCNA10) belong to taxonomic families, which are widely recognised as common producers of SCFAs.37–39 Therefore, we analysed rectal samples from all matched patients (severe n=28, non-severe n=53) regarding their functional profiles. For GSEA, two different gene background lists were created: (1) KEGG orthologies (KOs) cluster for KEGG pathway (n=452) and (2) KOs cluster for KEGG modules (n=477). Interestingly, GSEA of KOs calculated for KEGG modules revealed functional pathway units which contribute to SCFA production to be more expressed in severe APs compared with non-severe (figure 4G, online supplemental figure S12 and online supplemental material). All count-tables KEGG orthologies per sample are publicly available.40
Discussion
Alterations of the human microbiome have been linked to a variety of inflammatory conditions. Here, we aim to explore associations between the microbiome and clinically relevant parameters in the early phase of AP. To this end, we prospectively enrolled 450 patients in 8 European countries from 15 centres to evaluate the oral and intestinal microbiome by full-length 16S rRNA and metagenomic sequencing. Our microbial data convincingly show for the first time that the orointestinal microbiome is associated with established parameters of severity in AP.
Stool is widely used to investigate the gut microbiome and was considered as gold standard.41 However, we decided to use rectal swabs to determine intestinal microbial compositions in patients with AP. The timing was crucial for sample collection as our aim was to assess the microbiome within 72 hours of admission. Most patients with AP suffer from severe pain and frequently require opioids that contribute to bowel paralysis in the early phase rendering sample collection unreliable in the 72-hour timeframe. Previous studies exploring the intestinal microbiome in AP also used rectal swabs.25 26 Furthermore, due to the oxygen gradient, there are different horizontal niches of the gut microbiomes. Therefore, the microbiome derived from rectal swabs is more similar to biopsy-derived microbiome than to faeces.42 Accordingly, rectal swabs harbour more microbes adjacent to the mucosa compared with stool samples that represent more the anaerobic luminal microbiota.
Notably, our microbial data from rectal swabs were sequenced with a whole metagenomic approach, whereas the buccal swabs were analysed using a full-length 16S rRNA approach due to the lower biomass that did not reliably yield sufficient sequencing depths. The major advantage of both approaches for long-read based sequencing is resolution at species level and consequently a more profound microbial analysis.43 In contrast, existing studies only investigated dysbiosis between healthy subjects and patients with AP, included less than 60 patients and used short-read 16S rRNA sequencing describing microbiome alterations at genus or higher taxonomic ranks.23 25 26
Regarding our study population from eight European countries, the age distribution with a peak between 50 and 60 years as well as the overall mortality of ~2% are comparable to previously published epidemiological data.44 Also in line with previous reports, gallstones (52.1%) and alcohol use (21.7%) were the most common causes of AP followed by idiopathic AP with 13.6%.44 Since the RAC does not distinguish whether pancreatic fluid collections require interventional drainage, the majority of RAC II patients had a relatively mild course of disease with organ failure <48 hours mostly due to existing comorbidities and self-limiting fluid collections. In contrast, a smaller subgroup within RAC II required interventional drainage and had a significantly prolonged hospital stay prompting us to define severe AP with organ failure (>48 hours) and/or the occurrence of pancreatic collections that required interventional therapy. On the contrary, patients with pancreatic collection without the need for drainage and absence of persistent organ failure were considered as non-severe AP.
Importantly, our microbial data demonstrate that alterations of the microbiome are associated with the RAC, disease severity, mortality and length of hospital stay. However, an association of the microbiome with clinical endpoints can be confounded by multiple internal and external factors such as gender, previous medication and pre-existing diseases31 that are sometimes not sufficiently accounted for in major microbiome studies.45 Thus, we carefully collected and factored in multiple known confounding features using a comprehensive approach which was previously applied by our group.46 Using this approach, we have not observed any significant differences regarding 79 potential confounding factors between severe and non-severe AP. In addition, to further reduce the impact of these confounding factors on microbial composition and to identify differentially abundant species which most likely explain the observed differences between severe and non-severe AP, we extracted a subpopulation from non-severe AP that matched best to the smaller severe AP group. Differential abundance calculation of this matched cohort identified 16 intestinal species that could be applied to build a classifier for severity on the whole population. This classifier outperformed widely used scoring systems such as BISAP, HAPS and SIRS. Notably, the combination of SIRS and 16 differentially abundant species yielded the best discriminator between patients with severe and non-severe AP. Importantly, clinical score assessment and microbial sampling should be performed in parallel to avoid biases introduced by delayed microbial sampling. Although this is currently the largest cohort for microbiome analysis in the context of AP, the sample size of severe patients (n=28) remains relatively small. Consequently, future studies are required to validate the performance of the respective classifier.
Unexpectedly, all differentially abundant species in severe AP belong to families which are recognised as common producers of SFCAs,37–39 and subsequent GSEA revealed functional pathway units contributing for SCFA production. In contrast to our findings, SCFAs are widely considered for having beneficial effects in multiple diseases, including ameliorating acute pancreatitis.47–49 One explanation could be the fact that previous translational animal studies examined the luminal microbiome from stool samples. As rectal swabs represent more the mucosa-adherent microbiome, the differences observed in our study might the consequence of niche-specific changes on severe AP. This spatial variation of dysbiosis is a common phenomenon in other intestinal microbiome alternating diseases.50 51 However, there is evidence that SCFA producing species and strains also might be harmful. For instance, it was shown that they contribute to disease progression in metabolic diseases and inflammatory bowel diseases due to an excess of propionate.52 53 Furthermore, the PROPATRIA trial that examined the prophylactic effect of probiotics in predicted patients with severe AP had to be stopped after interim analysis since mortality was increased in the probiotic arm.22 Intriguingly, the probiotic formula applied in this trial consisted of six SCFA-producing species.54 Currently, we can only speculate whether SCFA producing bacteria are cause or consequence during the early phase of severe AP. Thus, it would be interesting to explore the dynamics and function of SCFA-producing species and targeted metabolomics during the onset of severe AP. Possibly, this knowledge could guide novel diagnostic, therapeutic and preventive concepts and clinical trials in the future.
Currently, our workflow from sample collection, DNA extraction, sequencing and bioinformatical analysis takes up to 4 days and limits the utility of a point-of-care diagnostics in clinical routine. However, we have already tested a fast-track workflow that would enable us to obtain reliable microbiome data from buccal and rectal swabs within few hours. This fast-track approach could pave the way for interventional clinical studies that are urgently needed to improve the individual management and overall outcome of patients with AP.
Professional societies have endorsed endoscopic ultrasound-guided gallbladder drainage (EUS-GBD) as an alternative to percutaneous cholecystostomy in high-risk surgical patients with acute cholecystitis. In a retrospective case series, we encountered 3 of 25 patients who improved clinically after EUS-GBD and subsequently had their surgical risk status reversed when cholecystectomy was indicated due to persistent symptoms. However, the presence of a lumen-apposing metal stent (LAMS) precluded a minimally invasive surgical approach and necessitated conversion to open or subtotal cholecystectomy. Therefore, EUS-GBD should be reserved for a selective cohort of never-surgery patients and not for all patients broadly stratified as high-risk surgical candidates.
In more detail
Randomised trials and meta-analysis comparing EUS-GBD using LAMS versus percutaneous cholecystostomy in high-risk surgical patients with acute cholecystitis have favoured EUS-GBD as it is associated with lower rates of adverse events, reinterventions and readmissions.1 2 Therefore, the European Society of Gastrointestinal Endoscopy guidelines, American Gastroenterological Association practice update and Tokyo Guidelines have endorsed EUS-GBD as an alternative to percutaneous cholecystostomy in high-risk surgical patients.3–5 More recently, the US Food and Drug Administration approved the use of LAMS for gallbladder drainage in high-risk patients unfit for cholecystectomy. Given the lack of long-term follow-up data, we examined the clinical outcomes of EUS-GBD at our institution.
This was a retrospective study of patients who underwent EUS-GBD between July 2021 and June 2023 at Orlando Health in Orlando, Florida. Patients with acute cholecystitis deemed high-risk for surgery and whose gallbladder were located adjacent to the gastric or duodenal lumen were included. Excluded were patients whose gallbladder were inaccessible for EUS-GBD or had irreversible coagulopathy. EUS referrals were made by internists in consultation with acute care or general surgeons. All procedures were performed with a linear array echoendoscope under monitored anaesthesia care using propofol administered by anaesthesiologists. The LAMS (Hot AXIOS, Boston Scientific) used in this study had a single-step cautery-tipped delivery system with dimensions of 15 mm (diameter) by 10 mm (length). Anchoring plastic stents were not placed in any patient. The site through which the stent was deployed was either the stomach or duodenum depending on proximity to the gallbladder. All patients were discharged from hospital after resolution of presenting symptoms. Outpatient and inpatient medical records were reviewed to obtain clinical follow-up. The primary outcome measure was symptom recurrence necessitating subsequent reintervention. Secondary outcome was adverse events.
Twenty-five patients (12 females, median age 74 years (IQR, 57–82)) underwent EUS-GBD over a 24-month period. All patients presented with sepsis or acute cholecystitis and underlying aetiology were gallstones (72%) or inoperable pancreatic-biliary malignancy causing cystic duct obstruction (28%). Reasons for poor surgical candidacy were terminal malignancy (n=8), coronary artery disease (n=7), advanced cirrhosis (n=1), irreversible neurological disease (n=4) and advanced age (>85 years; n=5). LAMS was placed via the stomach in 14 patients (56%) and duodenum in 11 (44%). While 24 of 25 (96%) patients had resolution of sepsis/cholecystitis within 48 hours, an adverse event of bile leak was observed in one (4%) who had pancreatic cancer and opted for hospice care. The median length of hospital stay after LAMS placement was 3 days (IQR, 2–6).
At median follow-up of 277 days (IQR, 170–393), 17 patients were alive and 8 were deceased due to progression of malignancy (n=4), neurological deterioration (n=2) and sepsis from COVID-19 (n=1) or spontaneous bacterial peritonitis (n=1). Of 17 patients who were alive, 9 were asymptomatic (52.9%) and 8 (47.1%) reported persistent biliary-type pain that warranted reintervention in 3 (12%). Attempted minimally invasive (robotic/laparoscopic) cholecystectomy by general surgeons was unsuccessful in all three patients, who had undergone transgastric EUS-GBD, due to presence of pericholecystic adhesions and/or cholecystogastric fistula attributed to indwelling LAMS that necessitated conversion to open or subtotal cholecystectomy (figure 1) (median surgery duration, 135 min (range, 120–185)). At 3-month follow-up, all three patients were clinically well without ongoing symptoms.
Comments
Cholecystectomy is a commonly performed surgical procedure with the vast majority being undertaken laparoscopically. For patients who are not surgical candidates, percutaneous cholecystostomy is the preferred non-operative method for gallbladder decompression. The Tokyo Guidelines recommend percutaneous cholecystostomy for patients with severe acute cholecystitis who are graded ≥3 by the American Society of Anesthesiologists, graded ≥4 by the Charlson comorbidity index, jaundiced or have neurological or respiratory dysfunction.6 Although optimal timing for reassessment of patients with percutaneous drainage catheter for definitive treatment is debatable, a general consensus is 4–6 weeks.
EUS-GBD is proposed as a novel treatment option in lieu of percutaneous cholecystostomy for high-risk surgical patients.4 In the present study, the surgical risk status of 3 of 25 patients (12%) was reversed after EUS-GBD. All three patients at initial presentation were septic and had cardiac comorbidities that placed them at high-risk for undergoing surgery. However, after resolution of sepsis, the surgical risk stratification was lowered. When subjected to minimally invasive cholecystectomy, the procedures were technically unsuccessful due to the presence of an indwelling transgastric LAMS.
In a Medicare claims analysis, an increase of 567% was observed in patients undergoing percutaneous cholecystostomy as compared with only 3% for laparoscopic cholecystectomy.7 This trend is likely because by providing temporary decompression, percutaneous cholecystostomy acts as a bridge to surgery. While EUS-GBD in lieu of percutaneous cholecystostomy may not impede performance of open cholecystectomy in majority of patients, it could however negatively impact minimally invasive technical approaches. Therefore, EUS-GBD should not be offered as a routine alternative to percutaneous cholecystostomy in all high-risk surgical patients, particularly when the underlying comorbidity is potentially reversible. Preferably, the procedure should be relegated to a subset of patients who are never-surgery candidates, such as those with primary pulmonary hypertension, advanced cirrhosis, inoperable malignancy or irreversible severe neurological dysfunction.
Another important take-home message from the present study is that more than 50% of patients had persistent biliary-type pain after EUS-GBD. While the acute illness (cholecystitis) may have resolved, the presence of LAMS may not relieve pain originating from a chronically diseased gallbladder. Also, long-term high-quality data on indwelling LAMS are lacking.8 In patients with prolonged life expectancy or in those with recurrent cholecystitis (reported at 6%), treatment options may include exchange of LAMS for double pigtail plastic stents or endoscopic lithotripsy with retrieval of gallstones via the LAMS.8 Should cholecystectomy be undertaken, some authors recommend removal of LAMS prior to surgery with endoscopic closure of the fistula tract.9 While EUS-GBD can be undertaken by adopting either a transgastric or transduodenal route, the transgastric approach provides the advantage of easier closure of the fistula endoscopically after LAMS removal or intraoperatively where surgical mobilisation and repair are relatively easier to perform. In one recent retrospective study comparing outcomes among patients undergoing cholecystectomy after EUS-GBD or percutaneous cholecystostomy, 35% of the EUS-GBD cohort required open or conversion to open cholecystectomy; in two patients the surgery was aborted due to presence of significant inflammation.9 In our opinion, should surgery be contemplated in this patient cohort, it is best performed by expert surgeons for optimal outcomes.
In light of our preliminary experience in Orlando, we propose a practical algorithm to guide endoscopic management of acute cholecystitis (figure 2). While laparoscopic cholecystectomy should be the treatment of choice in low to moderate risk patients, those deemed inoperable at presentation should be stratified to high-risk or never-surgery status. High-risk patients will include those with potentially reversible comorbidities or in whom the risk status cannot be ascertained accurately due to the severity of clinical presentation. These patients should preferably be treated by percutaneous cholecystostomy or transpapillary cystic duct stenting at endoscopic retrograde cholangiopancreatography as a bridge to therapy and the surgical risk status reassessed at 4–6 weeks. While all operable patients should undergo minimally invasive cholecystectomy, the gallbladder and cystic duct patency should be assessed in the percutaneous cholecystostomy cohort by contrast injection via the percutaneous drain. The drainage catheter may be removed in patients with a patent cystic duct and acalculous gallbladder. In those with cystic duct obstruction or gallstones, lithotripsy or other manoeuvres may be undertaken via endoscopic or percutaneous approaches followed by removal of the percutaneous catheter. Should such approaches fail, or in the absence of requisite technical expertise, as an alternative method, EUS-GBD may be undertaken using LAMS. In the high-risk cohort treated by transpapillary stenting who cannot undergo surgery, the stent can be removed in asymptomatic patients; in others, particularly with residual gallstones, the transpapillary stent may need to be exchanged periodically or patients may undergo EUS-GBD as definitive palliative measure. For patients deemed to be never-surgery candidates, given the need for fewer reinterventions and better quality of life, EUS-guided GBD using LAMS should be the preferred first-line treatment option and considered destination therapy. Percutaneous cholecystostomy or transpapillary cystic duct stenting can be undertaken as second line measures when EUS expertise is unavailable or technically not possible.
Proposal from Orlando for multidisciplinary approach to management of acute cholecystitis in the era of EUS-guided lumen-apposing metal stent for gallbladder drainage. EUS, endoscopic ultrasound; GBD, gallbladder drainage.
In summary, EUS-GBD is a highly effective technique for relief of acute cholecystitis in patients who are never-surgery candidates. Accurate preprocedural risk stratification is important as performance of EUS-GBD can potentially preclude subsequent attempts at minimally invasive cholecystectomy. Therefore, multidisciplinary consensus is essential to guide clinical management. Finally, long-term data are needed in patients with indwelling LAMS to further optimise endoscopic management of acute cholecystitis.
Child’s death, divorce or job loss linked to poorer cognition in later life, study finds, with African Americans more susceptible
Stressful life experiences can age the brain by several years, new research suggests. Experts led by a team from Wisconsin University’s school of medicine and public health in the US found that even one major stressful event early in life may have an impact on later brain health.
The team examined data for 1,320 people who reported stressful experiences over their lifetime and underwent tests in areas such as thinking and memory. The subjects’ average age was 58 and included 1,232 white Americans and 82 African Americans. A series of neuropsychological tests examined several areas, including four memory scores (immediate memory, verbal learning and memory, visual learning and memory, and story recall).
Stressful life experiences included things such as losing a job, the death of a child, divorce or growing up with a parent who abused alcohol or drugs. The results showed that a larger number of stressful events was linked to poorer cognitive function in later life.
When looking specifically at African Americans, the team found they experienced 60% more stressful events than white people during their lifetimes. Researchers said that, in African Americans, each stressful experience was equivalent to approximately four years of cognitive ageing.
The study, which has not been published in a peer-reviewed journal, was presented at the Alzheimer’s Association international conference in London.
Dr Maria Carrillo, the chief science officer for the Alzheimer’s Association, said: “The stressful events that the researchers were focusing on were a large variety … the death of a parent, abuse, loss of a job, loss of a home … poverty, living in a disadvantaged neighbourhood, divorce.” She said that even a change of school could be regarded as a stressful life event for some children.
Dr Doug Brown, the director of research at the Alzheimer’s Society, said: “We know that prolonged stress can have an impact on our health, so it’s no surprise that this study indicates stressful life events may also affect our memory and thinking abilities later in life. However, it remains to be established whether these stressful life events can lead to an increased risk of dementia.
“Studying the role of stress is complex. It is hard to separate from other conditions such as anxiety and depression, which are also thought to contribute towards dementia risk.
“However, the findings do indicate that more should be done to support people from disadvantaged communities that are more likely to experience stressful life events. As we improve our understanding of risk factors for dementia, it is increasingly important to establish the role that stress and stressful life events play.”
Other research has suggested there are plausible links between stress and chronic inflammation, which in turn may accelerate the development of dementia. But experts believe that a health lifestyle and a healthy diet can help mitigate this risk, even for those people going through stressful events.
Research finds distinctive language deficits in people with mild cognitive impairment, a precursor to dementia
Rambling and long-winded anecdotes could be an early sign of Alzheimer’s disease, according to research that suggests subtle changes in speech style occur years before the more serious mental decline takes hold.
The scientists behind the work said it may be possible to detect these changes and predict if someone is at risk more than a decade before meeting the threshold for an Alzheimer’s diagnosis.
Janet Cohen Sherman, clinical director of the Psychology Assessment Center at Massachusetts General Hospital, said: “One of the greatest challenges right now in terms of Alzheimer’s disease is to detect changes very early on when they are still very subtle and to distinguish them from changes we know occur with normal ageing.”
Speaking at the American Association for the Advancement of Science in Boston, Sherman outlined new findings that revealed distinctive language deficits in people with mild cognitive impairment (MCI), a precursor to dementia.
“Many of the studies to date have looked at changes in memory, but we also know changes occur in language,” she said. “I’d hope in the next five years we’d have a new linguistic test.”
Sherman cites studies of the vocabulary in Iris Murdoch’s later works, which showed signs of Alzheimer’s years before her diagnosis, and the increasingly repetitive and vague phrasing in Agatha Christie’s final novels – although the crime writer was never diagnosed with dementia. Another study, based on White House press conference transcripts, found striking changes in Ronald Reagan’s speech over the course of his presidency, while George HW Bush, who was a similar age when president, showed no such decline.
“Ronald Reagan started to have a decline in the number of unique words with repetitions of statements over time,” said Sherman. “[He] started using more fillers, more empty phrases, like ‘thing’ or ‘something’ or things like ‘basically’ or ‘actually’ or ‘well’.”
Worsening “mental imprecision” was the key, rather than people simply being verbose, however. “Many individuals may be long-winded, that’s not a concern,” said Sherman.
Sherman and colleagues had initially set out to test the “regression hypothesis”, the idea that language is lost in a reverse trajectory to how it was acquired during childhood, with sophisticated vocabulary being the first thing to go.
The hypothesis turned out to be wrong, but the team did find that dementia is accompanied by characteristic language deficits. In a study, the scientists compared the language abilities of 22 healthy young individuals, 24 healthy older individuals and 22 people with MCI.
When given an exercise in which they had to join up three words, for instance “pen”, “ink” and “paper”, the healthy volunteers typically joined the three in a simple sentence, while the MCI group gave circuitous accounts of going to the shop and buying a pen.
“They were much less concise in conveying information, the sentences they produced were much longer, they had a hard time staying on point and I guess you could say they were much more roundabout in getting their point across,” said Sherman. “It was a very significant difference.”
In another test, people were asked to repeat phrases read out by the investigator. Complex vocabulary or grammar was not a problem, but those with MCI appeared to have a mental block when they were given phrases involving ambiguous pronouns, such as “Fred visited Bob after his graduation”, which the scientists said required more mental agility to assign a meaning.
The prospect of an effective treatment for Alzheimer’s has had knockbacks in the past year as a string of drugs designed to sweep away the amyloid plaques seen in the brains of patients have each been shown to make no difference to the rate of cognitive decline in trials. Between 2002 and 2012, 99.6% of drugs studies aimed at preventing, curing or improving Alzheimer’s symptoms were either halted or discontinued.
Some believe that these failures may be, in part, because by the time Alzheimer’s is diagnosed, the disease has already caused irreparable damage to the brain, making it too late for treatment to help.
“So we are trying to push the detection period back to the very subtle, early changes in in Alzheimer’s disease,” said Sherman.
There are 850,000 people with dementia in Britain and this figure is expected to reach 1 million by 2025. Last year, dementia overtook heart disease as the leading cause of death in England and Wales.
Researchers at Stanford Medicine developed a new artificial intelligence model that in tests was found to be more than 90% successful at determining whether MRI scans of human brain activity were from a man or from a woman.
“A key motivation for this study is that sex plays a crucial role in human brain development, in aging, and in the manifestation of psychiatric and neurological disorders,” said Vinod Menon, PhD, professor of psychiatry and behavioral sciences and director of the Stanford Cognitive and Systems Neuroscience Laboratory. “Identifying consistent and replicable sex differences in the healthy adult brain is a critical step toward a deeper understanding of sex-specific vulnerabilities in psychiatric and neurological disorders.”
In their report, the investigators concluded, “Our findings underscore the crucial role of sex as a biological determinant in human brain organization, have significant implications for developing personalized sex-specific biomarkers in psychiatric and neurological disorders, and provide innovative AI-based computational tools for future research.” The lead authors are Srikanth Ryali, PhD, and academic staff researcher Yuan Zhang, PhD.
Sex plays a significant role in early brain development, adolescence, and aging, the authors noted. Moreover, they pointed out, “Sex is an important biological factor that influences human behavior, impacting brain function and the manifestation of psychiatric and neurological disorders … Consequently, knowledge of sex differences in the human brain is critical for understanding both normative behavior and psychopathology.” In fact, the extent to which a person’s sex affects how their brain is organized and operates has long been a point of dispute among scientists, the scientists suggested.
While we know the sex chromosomes we are born with help determine the cocktail of hormones our brains are exposed to—particularly during early development, puberty, and aging—researchers have long struggled to connect sex to concrete differences in the human brain. Brain structures tend to look much the same in men and women, and previous research examining how brain regions work together has also largely failed to turn up consistent brain indicators of sex. “… previous research on how brain organization differs between males and females has been inconclusive,” the investigators pointed out. “… our understanding of sex differences in human functional brain organization and their behavioral consequences has been hindered by inconsistent findings and a lack of replication.”
For their newly reported study, Menon and colleagues took advantage of recent advances in artificial intelligence, as well as access to multiple large datasets, to pursue a more powerful analysis than has previously been employed. First, they created an end-to-end spatiotemporal deep neural network (stDNN) model, which they trained to classify data from resting-state functional MRI (rsfMRI) brain images from the Human Connectome Project (HCP). As the researchers showed brain scans to the model and told it that it was looking at a male or female brain, the model started to “notice” what subtle patterns could help it tell the difference. “Our stDNN model uncovered reliable sex differences with over 90% cross-validation classification accuracies, outperforming previous studies,” the scientists stated.
The team assessed the replicability of their predictive model on additional datasets, without further training. When tested on around 1,500 brain scans, the stDNN model could almost always tell if the scan came from a woman or a man. It also demonstrated superior performance compared with models used in previous studies, in part because it uses a deep neural network that analyzes dynamic rsfMRI scans. This approach captures the intricate interplay among different brain regions. “Critically, our model outperformed previous studies in both test and independent dataset,” the team noted.
The model’s success suggests that detectable sex differences do exist in the brain, but that they hadn’t been picked up reliably before. The fact that the model worked so well in different datasets, including brain scans from multiple sites in the United States, and Europe, makes the findings especially convincing as it controls for many confounders that can impact studies of this kind. “This is a very strong piece of evidence that sex is a robust determinant of human brain organization,” Menon said.
Until recently, a model such as the one employed by Menon’s team would have helped researchers sort brains into different groups but wouldn’t have been able to provide information about how the sorting happened. However, researchers today have access to a tool called explainable AI (XAI), which can sift through vast amounts of data to explain how a model’s decisions are made.
Using explainable AI, Menon and his team identified the brain networks that were most important to the model’s judgment of whether a brain scan came from a man or a woman. They found that the “hotspots” that most helped the model distinguish male brains from female ones included the default mode network (DMN), a brain system that helps us process self-referential information, and the striatum and limbic network, which are involved in learning and how we respond to rewards.
Notably, they pointed out, the DMN, striatum, and limbic network are also “loci of dysfunction in psychiatric disorders with female or male bias in prevalence rates, including autism, attention deficit disorders, depression, addiction, schizophrenia, and Parkinson’s disease all of which have sex-specific sequelae and outcomes.” Their findings, the team suggested, “… may therefore offer a template for investigations of sex differences in vulnerability to individual psychiatric and neurological disorders.”
The researchers in addition wondered if they could create another model that could predict how well participants would do on certain cognitive tasks based on functional brain features that differ between women and men. To do this they developed sex-specific models of cognitive abilities. One model effectively predicted cognitive performance in men but not women, and another in women but not men. The findings indicated that functional brain characteristics varying between sexes have significant behavioral implications. “Critically, the brain features identified by XAI that reliably distinguished functional brain organization between sexes also predicted unique cognitive profiles in females and males,” the authors commented.
In summary of their findings, they concluded, “Our approach using spatiotemporal DNNs and XAI techniques identifies replicable, generalizable, and interpretable sex differences in human functional brain organization across multiple datasets and independent cohorts and, furthermore, reveals that functional brain features that differ between sexes are behaviorally relevant.”
Biomarkers of Alzheimer’s disease are present early, and their levels evolve over time, according to a large study by researchers at Beijing’s Innovation Center for Neurological Disorders. The biological markers of Alzheimer’s progression included amyloid-beta (Aβ)42, the ratio of Aβ42 to Aβ40, phosphorylated tau 181, total tau, neurofilament light chain, and hippocampal volume. Notably, these signs’ appearance and persistence changed with time.
As cognitive impairment progressed, the team reports, the changes in CSF biomarker levels in the Alzheimer’s disease group initially accelerated and then slowed.
The study was published this week in The New England Journal of Medicine. Jianping Jia, MD, PhD, is the lead author.
It is estimated that over 50 million people worldwide have some form of dementia, and that by 2050 this number will climb to over 150 million. While new drugs are being introduced that finally address the underlying biology of the disease, these are few and don’t have much effect. It is believed that early diagnosis will aid drug development and treatment.
Preclinical Alzheimer’s disease is characterized by normal cognitive function and abnormal levels of specific cerebrospinal fluid (CSF) biomarkers. This preclinical stage is typically followed by mild cognitive impairment, which sometimes progresses to clinically apparent dementia.
Notably, changes in biomarker levels can begin 15 to 20 years before clinical signs of Alzheimer’s disease. Changes in CSF biomarkers. such as levels of amyloid-beta (Aβ), total tau, phosphorylated tau 181, and neurofilament light chain (NfL) have been indicators in preclinical Alzheimer’s disease that become abnormal sequentially rather than simultaneously.
There’s also a difference between familial and sporadic Alzheimer’s disease. In the sporadic disease a person’s clinical course, beginning with normal cognition and progressing to Alzheimer’s disease, “cannot be predicted,” the authors write. Also, they note, past studies have had an “Underrepresentation of Asian populations… In addition, the relatively short follow-up periods in previous studies do not reflect the lengthy trajectory over decades of biomarker alterations leading to the onset of Alzheimer’s disease.”
This team compared 648 people eventually diagnosed with Alzheimer’s with an equal number who did not develop the disease. All were enrolled in the China Cognition and Aging Study from January 2000 through December 2020. A subgroup of these patients underwent cerebrospinal fluid (CSF) testing, cognitive assessments, and brain imaging at two-year–to–three-year intervals.
The first sign the researchers saw was positive amyloid testing—18 years or 14 years prior to diagnosis depending on the test used. Differences in tau were also detected, followed by a marker of trouble in how neurons communicate. A few years later, differences in brain shrinkage and cognitive test scores between the two groups became apparent.
Specific findings were that CSF and imaging biomarkers in the Alzheimer’s disease group diverged from the cognitively normal group specific points: amyloid-beta (Aβ)42, 18 years; the ratio of Aβ42 to Aβ40, 14 years; phosphorylated tau 181, 11 years; total tau, 10 years; neurofilament light chain, nine years; hippocampal volume, eight years; and cognitive decline, six years.


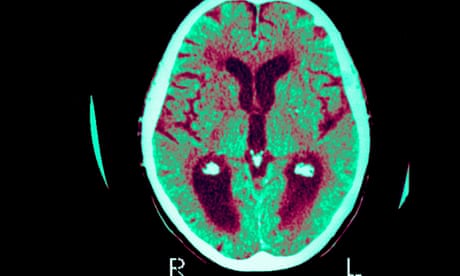


