25 Years of Data Shows We Missed Something Important About Sea Level Rise


Satellite data measured across a 25-year period shows that not only are the seas rising, they’re rising faster and faster – an acceleration that is on track to double the jump in sea levels by 2100 compared with a fixed increase year-on-year.

The acceleration is driven mainly by more and more of the ice in Greenland and Antarctica melting away, according to the scientists, who are warning that more data needs to be gathered to prepare for the effects of sea level rise.

Right now the oceans rise by around 3 millimetres each year, but that number is going up by 0.08 mm every 12 months, the data shows. By the time the next century rolls around, we could be up to a rise of 10 mm every year.

In total we would be looking at a rise of 65 centimetres (25 inches) by 2100, compared with around 30 cm if the annual rises steadied at the current speed.

“This is almost certainly a conservative estimate,” says one of the team, Steve Nerem from the University of Colorado Boulder.

“Our extrapolation assumes that sea level continues to change in the future as it has over the last 25 years. Given the large changes we are seeing in the ice sheets today, that’s not likely.”

The study looked at altimeter readings from various satellites stretching back to 1992, adding in data from climate change models to factor out the variability of events like El Niño and volcanic eruptions, and reach a baseline figure.

Further corrections were made using tide-gauge data collected on the coasts, to tweak and verify the readings provided by the satellites. The end result is a prediction model that matches up very well with forecasts put forward by the Intergovernmental Panel on Climate Change (IPCC) set up by the UN.

According to Nerem and his colleagues, about half of the 7cm (2.76 inch) rise in global mean sea level we’ve seen since 1992 has been down to thermal expansion – the way water takes up more space as it gets warmer.

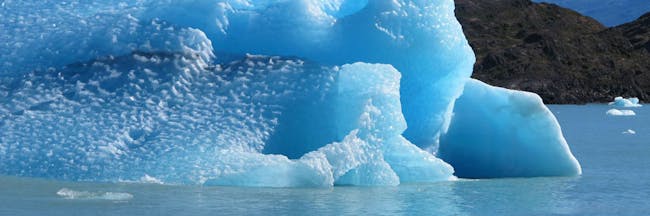
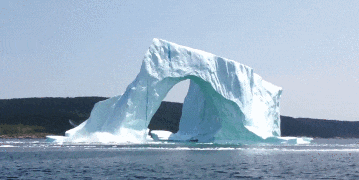
The other half is down to melting ice sheets, and this is what’s driving the acceleration. Last year another huge chunk of ice began to break off Antarctica, and scientists are worried that it’s now too late for these glaciers to recover.

This new study is by no means the first to suggest the waters are rising at a faster and faster rate. Last year, research published in Nature Climate Change found that the rise-per-year had gone up by 50 percent between 1993 and 2014.

Again, the melting of the Greenland ice sheet was put forward as the primary cause of this acceleration. Perhaps the only positive we can take from all this is that we’re getting a better idea of what we’re up against, and might be able to do something about it.

Now the researchers want to apply the same techniques to a longer period of time, as well as adding in extra measurements from local records, which should help communities prepare for the worst.

“This estimate is useful for understanding how the Earth is responding to warming, and thus better informs us of how it might change in the future,” write the researchers in their published paper.

25 Years of Satellite Data Uncover Alarming Error in Sea Level Measurements


The Earth is changing in ways that could cause an actual mass extinction during our lifetimes. In recent years, scientists have made it abundantly clear that humans are driving climate change, but what they’ve only recently found out is how quickly we’re making the Earth more inhospitable. In a new study published Monday in Proceedings of the National Academy of Sciences, they report that the rate at which the climate getting worse is actually increasing each year.

In the paper, a team of climate researchers shows evidence that global sea levels are rising at an accelerating rate. Scientists previously thought that sea level rise was constant at 3 millimeters per year or even slowing, but this new study, first-authored by R. Steven Nerem, associate director of the Colorado Center for Astrodynamics Research, shows that the annual global average sea level rise has increased by about 0.08 millimeters each year.

Climate researchers say global sea level is rising at an accelerating rate, contrary to previous research suggesting a stable rate.

Sea level rise is a combination of water expanding as sea water temperatures rise and water levels rising as long-frozen glaciers melt and join the oceans. Climate change has exacerbated both of these factors, and this new research suggests that the effect is larger than previously predicted.

Previous calculations were off because of a combination of miscalibrated instruments and unique environmental factors, write the researchers. For example, the satellite TOPEX/Poseidon was launched in 1992 to measure ocean topography, but the year before that, Mount Pinatubo erupted in the Philippines. These seemingly unconnected events actually interacted in a strange way: That eruption caused a modest decrease in global mean sea level, which made the first years of TOPEX/Poseidon measurements show a deceleration in sea level rise.

Mount Pinatubo
Mount Pinatubo’s eruption in 1991 threw off the satellite that measures sea level rise.

The next 25 years combined minor calibration errors in tide-gauges and other satellite altimetry equipment, which ultimately averaged out to show a misleadingly steady increase. As part of the new study, the researchers corrected for this statistical noise, showing that the rate of sea level rise actually slowly accelerated over this time period.

A 0.08-millimeter annual rise sounds small, but over many years, it will add up to a big difference. By these calculations, global sea levels could rise by up to 77 centimetersby the year 2100.

This could worsen coastal flooding, which was already predicted to get more severe when scientists predicted it at previous sea level measurements.

The new PNAS study comes hot on the heels of another study, published in December 2017, that also shows evidence that scientists have underestimated sea level rise. In that study, researchers say satellite altimetry is insufficient for measuring increased water volume because the seafloor is also sinking.

With these two papers, the case is becoming clearer that climate change research is constantly being refined and corrected, and that as that happens, the picture becomes increasingly dire. Let’s see what we find out next.

Abstract: Using a 25-y time series of precision satellite altimeter data from TOPEX/Poseidon, Jason-1, Jason-2, and Jason-3, we estimate the climate-change–driven acceleration of global mean sea level over the last 25 y to be 0.084 ± 0.025 mm/y2. Coupled with the average climate-change–driven rate of sea level rise over these same 25 y of 2.9 mm/y, simple extrapolation of the quadratic implies global mean sea level could rise 65 ± 12 cm by 2100 compared with 2005, roughly in agreement with the Intergovernmental Panel on Climate Change (IPCC) 5th Assessment Report (AR5) model projections.

30 Years of Satellite Data Reveal Unexpectedly Bad News for the Ozone Layer


In June 2016 scientists announced that there was evidence of the “first fingerprints of healing” in the ozone layer above Earth’s poles. This was great news: We need the ozone layer to absorb UV radiation from the Sun, and holes mean that radiation can pass through and damage the DNA of plants and animals. Closing them up meant we were finally doing something right for the environment.

ozone layer

On Tuesday, however, an international team of researchers scaled back the excitement with a grave announcement in Atmospheric Chemistry and Physics: Despite the progress at the poles, the swath of the ozone layer at lower latitudes — a region covering London, New York City, and Buenos Aires, and many other big cities — is not recovering. This huge stretch of the globe, they write, not only covers the most highly populated regions but also gets the most intense sunshine.

It is “not a good signal for skin cancer,” study co-author and Grantham Institute for Climate Change co-director Joanna Haigh, Ph.D., told The Guardian on Tuesday.

stratosphere
Ozone forms in the stratosphere and we live in the troposphere.

What’s most concerning is that the Haigh and her team don’t really know why recovery is stalling at lower latitudes.

“The finding of declining low-latitude ozone is surprising since our current best atmospheric circulation models do not predict this effect,” co-author William Ball, Ph.D., said in the statement. “Very short-lived substances could be the missing factor in these models.”

The success we’ve had at closing up the ozone holes at the poles has been attributed to the Montreal Protocol, a United Nations agreement passed in 1987 ordering the phase-out of chemicals called CFCs. These chemicals, found in refrigeration systems and aerosols, drift into the stratosphere, release chlorine, and destroy ozone, a highly reactive gas. It’s not clear why these interventions have had more success at the poles than at lower latitudes.

The researchers have some theories: One thing driving the continuous decline in ozone is that climate change is altering the pattern of atmospheric circulation, shifting ozone further away from tropical latitudes. Another possibility is that very short-lived substances (VLS), chemicals that are used as solvents, paint strippers, and degreasing agents, may also be destroying the ozone in the lower stratosphere.

ozone layer
NASA’s prediction for ozone concentration levels. 

The researchers noticed the slowly recovering areas after examining satellite data collected since 1985, which allowed them to create a 30-year record of atmospheric ozone and how it’s been measured over the years. Analysis of the ozone levels between the 60th parallels — as far north as Alaska and as far south as the bottom tip of Argentina — revealed impaired ozone recovery in those regions.

This bodes poorly for us humans, said Haigh, explaining in the statement that “the potential for harm in lower latitudes may actually be worse than at the poles” because in these regions UV radiation is more intense and more people live there.

The next step for the researchers is gathering more precise data on ozone decline and determining exactly what is driving the impaired ozone recovery. They might want to do so sooner rather than later: Budget threats to United States satellites that monitor the changing climate could seriously endanger the progress of their research.

Headline: What Satellite Data Tells Us About Nepal’s Brutal Quake


How critical satellite and GPS data can be in assessing earthquakes, and the push by some researchers to acquire and analyze this information much more rapidly—especially for disaster responders. That data is now here for the 7.8 magnitude earthquake that struck Nepal and its neighbors on April 25. While it’s too late for these images to play a significant role in relief efforts that are already underway, scientists and those involved in earthquake recovery can still use them to learn a few new things about the earthquake.

Ground displacement map based on data gathered from the Sentinel-1A satellite.

Whenever an earthquake hits, one of the first things geologists want to do is locate and identify surface ruptures—places in the ground where the quake has cracked the rock all the way up to the surface. By creating and reading ground displacement maps, interferograms, and other satellite-derived imagery that highlights movements in the earth, scientists can tell where those surface ruptures might have occurred. And pinpointing those ruptures can help monitor and predict aftershocks and landslides.

Interferogram of Nepal and India, from satellite scans from April 17 and 29. In the northeast corner of the image lies Nepal. Fringes in color represent a few centimeters of ground deformation.

Right now, the data suggests that the Nepal quake didn’t create any new ruptures in the earth. But aftershocks above a 5.0 magnitude are expected to occur for at least another five months, which could disrupt relief efforts and threaten villagers who reside in the path of potential avalanches.

According to University of Iowa geologist William Barnhart, these images are also extremely helpful to scientists measuring more subtle changes in the vertical height of the ground along the fault line. Without satellite data, researchers would have to make physical measurements of movement on either side of the rock fracture—a time-consuming and dangerous process on unpredictable terrain. Instead, with a quick glance of the satellite imagery, earthquake researchers can characterize the physical shifts in the ground in a matter of minutes.

Interferogram of Nepal generated from satellite scans from April 17 and 29. Each fringe of color represents 2.8 cm of ground deformation.

Areas immediately south of the fault line, like Kathmandu, sank more than a meter into the ground as a result of the quake. Directly north of the fault slip, further into the Himalayas, the ground was lifted up by about a half meter, indicated by the yellow in the first map in the gallery above. These shifts in fault line are more data that scientists can use to predict what future tectonic movements in the region will look like—and what impact they might have.

Interferogram of Nepal generated from satellite scans from April 17 and 29. Each fringe of color represents 3 cm of ground deformation.

Barnhart demonstrated in a recent study that this kind of satellite data can be gathered and organized within 24 hours of an earthquake. Had this data been available by April 26, Barnhart thinks it “would have given us a more complete view of earthquake’s impacts sooner,” potentially helping resources reach the right places, faster. The death toll has risen to over 6,000, with thousands of other recovering from injuries and millions of people displaced.

Although the data wasn’t available immediately after the crisis, Barnhart is encouraged by how vocal his colleagues around the world have been in the last week in advocating for more rapid and improved situational awareness. There are plenty of changes that need to happen besides simply getting better data from instruments floating around the Earth, but it’s an important step towards safeguarding communities from earthquakes and other natural disasters.