Scientists are testing a new device to help target cancer cells more accurately in ion radiotherapy of head and neck tumours, which could help limit the treatment’s side effects. It includes Timepix3, a small particle detector developed at CERN
Mária Martišíková (left), the project leader from Heidelberg University Hospital and German Cancer Research Center (DKFZ), and DKFZ researcher Laurent Kelleter. (Image: Heidelberg University Hospital / H.Schroeder).
Particle detectors like the ones used by physicists at CERN can have wide applications beyond fundamental research. Scientists from the German National Center for Tumor Diseases (NCT), the German Cancer Research Center (DKFZ), and the Heidelberg Ion Beam Therapy Center (HIT) at Heidelberg University Hospital are now testing a new imaging device supplied by the Czech company ADVACAM on its first patients. The device, which includes a small Timepix3 pixel detector developed at CERN, allows head and neck tumours to be closely monitored during ion radiotherapy, making them easier to target and thus helping limit the treatment’s side effects.
“One of the most advanced methods for treating head and neck tumours involves irradiation with ion beams. This has one unique feature: it can be precisely tailored to the depth inside the human head where the particles should have the maximal effect”, explains Mária Martišíková, the head of the DKFZ team.
Yet like other types of irradiation, ion radiation also has a drawback. The particle beams affect not only the tumour but also part of the healthy tissue around it. This is particularly challenging in the brain, where damage to the optic nerve or a patient’s memory are possible. Ideally, the irradiated area around the tumour should be as small as possible, and the dose to the tumour should be as high as possible. However, current technology does not allow for sufficiently precise targeting of the ions.
To complicate matters further, the situation inside a patient’s head can change during therapy. The x-ray computed tomography (CT) scan image taken before treatment is essentially used as a “map” to target the tumour with ion beams. But during therapy, the situation inside the skull may evolve. Until now, physicians lacked a reliable tool to alert them in case of a change in the brain.
The new ADVACAM device could help solve these issues, by improving the navigation of the ion beams inside the head by tracking the secondary particles that are created when ions pass through it.
“Our cameras can register every charged particle of secondary radiation emitted from the patient’s body. It’s like watching balls scattered by a billiard shot. If the balls bounce as expected according to the CT image, we can be sure we are targeting correctly. Otherwise, it’s clear that the ‘map’ no longer applies. Then it is necessary to replan the treatment,” describes Lukáš Marek from ADVACAM.
“We hope the new device will show us how often and where the tumour changes occur. It will allow us to reduce the overall irradiated volume of tissue, saving healthy tissue and reducing the side effects of radiotherapy. We will also be able to apply higher doses of radiation to the tumour” adds Martišíková.
The treatment can benefit enormously from the additional information obtained from the camera. In the first phase, data could lead to an interruption and replanning of the irradiation series when necessary. The ultimate goal is a system that can correct the path of the ion beam in real-time.
The Timepix3 chip developed at CERN is used in the new ADVACAM imaging device. (Image: CERN)
This device exemplifies successful knowledge transfer, showcasing how technology initially developed for detectors used in fundamental physics research can be applied in healthcare.
“When we started developing pixel detectors for the LHC we had one target in mind – to detect and image each particle interaction and thereby help physicists to unravel the secrets of Nature at high energies. The Timepix detectors were developed by the multidisciplinary Medipix Collaborations whose aims are to take the same technology to new fields. Many of those fields were completely unforeseen at the beginning and this application is a brilliant example of that,” says Michael Campbell, Spokesperson of the Medipix Collaborations.
Seaweed on rocks. The plant is rich in nutrients and provides livelihoods for coastal communities in many lower-income countries. A study has found that it can survive and thrive even after a nuclear war.
Speed read
Seaweed can survive and thrive even after a nuclear war, study finds
Seaweed farming provides a livelihood for many poor coastal communities
NGO stresses the importance of avoiding a nuclear war at all cost
Imagine a catastrophic event that blocked out the sun, such as the eruption of a large volcano, or even a nuclear war.
An international team of researchers say resilient food sources are needed to save humanity from starvation in the case of such an event – and that seaweed could be the solution.
Seaweed is rich in nutrients and provides livelihoods for coastal communities in many lower-income countries.
“Investing in the construction of seaweed farms could prevent global famine in abrupt sunlight reduction scenarios, potentially averting a significant number of deaths from starvation,”said David Denkenberger, associate professor of mechanical engineering at the University of Canterbury, in the UK.
“Investing in the construction of seaweed farms could prevent global famine in abrupt sunlight reduction scenarios, potentially averting a significant number of deaths from starvation.”
David Denkenberger, associate professor of mechanical engineering, University of Canterbury
The research published in the journal Earth’s Future found that seaweed is a versatile commodity, which can serve as a critical food and fuel source when everything else becomes scarce following widespread catastrophe.
It is resilient enough to survive and thrive in tropical oceans even after a full-blown nuclear war, according to the researchers from the Alliance to Feed the Earth in Disasters, Louisiana State University, USA, University of the Philippines Marine Science Institute (UP-MSI), and the University of Canterbury.
The researchers constructed a model based on the seaweed Gracilaria tikvahiae, commonly known as graceful redweed. Using available nuclear winter climate data, they simulated the seaweed’s growth after an adverse global event.
Nuclear winter
According to the authors, if nuclear war broke out and thousands of warheads were exchanged between nuclear powers, an estimated 150 Teragram (Tg) of soot emissions could be ejected into the atmosphere, blocking the sunlight for years.
But they found that there would still be enough sunlight for seaweeds to photosynthesise and grow, even with black carbon in the atmosphere.
Michael Roleda, professor at UP-MSI and co-author of the study, told SciDev.Net: “Some seaweed species’ light requirement to saturate photosynthesis could be as low as 50-100 µmol photons.”
He said that sunlight in the tropics during the noon time of a cloudless day can reach almost 2,000 µmol photons.
With optimal area for production and preparation, seaweed could meet the equivalent of 45 per cent of global food demand after only nine months of intensified production, according to the study.
However, the researchers also noted that only up to 15 per cent of the human diet could be provided by seaweed due to its high iodine content.
Aside from an all-out nuclear war scenario, they said seaweed could be a viable addition to global food security now, as well as in smaller nuclear exchanges and volcanic eruptions.
Nutritional value
Seaweeds, often eaten in salads or as dried food wraps, are rich in proteins, minerals, vitamins, essential amino acids and fatty acids.
Asked if seaweeds would be fit for human consumption after a nuclear war, Roleda said they would naturally absorb contaminants from the environment, but the toxic substances bound and concentrated in the seaweeds could be reduced to safe levels.
“For example, post-harvest processing and pre-consumption preparation, like washing and drying, enzymatic reaction, and blanching or cooking, among others, have been found to significantly reduce iodine and heavy metals concentration in seaweeds,” he said.
Seaweed production is a lifeline for many families living in poor, coastal communities in lower-income countries.
The organism is largely protected underwater and can grow faster than any other known agricultural crop.
According to a Food and Agriculture Organization report in 2021, cultivated seaweed production in Asia contributed 97 per cent of the 34.7 million tonnes produced globally. As well as being consumed as food, it is used for animal food additives and cosmetics.
China currently produces more than 50 per cent of the world’s supply, followed by Indonesia. Other notable producers are South Korea and the Philippines.
Another recent study, however, offers a different perspective on the impact of a nuclear war and the dire consequences for all life globally, including the decimation of marine life.
The authors simulated the climate impacts of US-Russia and India-Pakistan nuclear wars and said the result would be global cooling, with sea ice expanding into coastal communities.
The ocean recovery, according to that study, would be very slow — decades at the surface and hundreds of years at depth, with thousands of years in cooler waters such as the Arctic. It said marine ecosystems would not only be deeply disrupted by the initial impact of a nuclear war, but would further deteriorate with the new ocean state, impacting the global ecosystem.
Ravi Rebbapragada, chair of Mines, Minerals & PEOPLE, an emerging alliance of environmental advocates in India, stressed that a nuclear war should be avoided at all costs, regardless of either findings.
“On a fundamental point, a nuclear war is not only dangerous but it will have a long-lasting effect on the global climate to a point of no return,” he said.
Its creators hope the technology will help people meaningfully connect with the external world.
A hand prosthesis outfitted with MindTouch for integrated thermal feedback.
KEY TAKEAWAYS
The earliest known prosthetics date back to ancient Egypt. One, called the “Cairo toe,” shows signs that it wasn’t simply cosmetic. Even 3,000 years ago, the wood-and-leather digit was designed for flexibility, suggesting it provided function alongside form.
TOP STORIES
Since then, people have worked hard to find ingenious means of improving the lives of people with amputations. Starting as early as the 15th century, engineers began incorporating cables, gears, and springs into prosthetics to give people the — albeit limited — ability to grasp objects and bend joints. Prosthetics were built to perform specific tasks, such as holding shields or playing the piano. And they became more comfortable with the discovery materials like rubber, plastics, and lightweight metals.
A prosthetic toe from ancient Egypt now housed in the Egyptian Museum, Cairo. The big toe is carved from wood and attached by a leather wrap.
However, until recently, one advance has been missing from this history: touch. Figuring out how to elicit feeling through a prosthetic is important because limbs and appendages aren’t simply mechanical tools. A person’s sense of touch allows them to embody experiences, and absent that, there remains a meaningful disconnect from the external world.
“Temperature is one of the last frontiers to restoring sensation to robotic hands. For the first time, we’re really close to restoring the full palette of sensations to amputees,” Silvestro Micera, the Bertarelli Foundation chair in translational neuroengineering at the Swiss Federal Institute of Technology Lausanne (EPFL), says.
FEATURED VIDEOS
Micera is part of a research team developing a device capable of doing just that. Their latest study, published last month in the journal Med, shows that the device can not only help a person distinguish between temperatures but that it can be paired with already existing prosthetics.
Feeling phantom heat
They call their tech “MindTouch,” and a previous study explains how it taps into “phantom thermal sensations.”
Phantom sensations (aka phantom limb syndrome) are the feeling that a missing limb is still there. For instance, if a person has had a hand amputated, they may sometimes feel the absent appendage moving or even being touched. Around 60-80% of amputees report phantom sensations, and for some, they can even be painful.
But MindTouch uses phantom sensations to its advantage.
The procedure starts with the researchers mapping a person’s residual limb to discover areas that reliably elicit phantom sensations when experiencing hot or cold. Over several mapping sessions, they identify the place that most consistently elicits phantom sensations.
They then retrofit a user’s prosthetic with a device called a “thermode.” The thermode rests against the user’s skin at that consistent point, sending temperature signals to the nerves of the residual limb. The temperature signals are retrieved by sensors placed on the fingertips of the prosthetic.
As one participant in the study explained, “The most impressive for me was when the experimenter placed the sensor on his own body. […] I could feel the warmth of another person with my phantom hand. It [was] having a connection with someone.”
For the current study, the researchers enlisted the help of a 57-year-old man who had a transradial amputation. The participant reported having mild to no phantom limb pain. Over 130 days, the researchers performed the thermal mapping before augmenting the participant’s prosthetic arm with MindTouch. They then performed a series of tests to determine if he could pick up on temperature differences.
The study participant’s prosthetic arm outfitted with MindTouch. Using the integrated thermal feedback, he is sorting warm and cold stainless steel cubes with a high accuracy.
During the first test, the participant was asked to close his prosthetic hand around three indistinguishable brown bottles, filled with either hot, cold, or lukewarm water.
The second test asked the participant to identify copper, glass, or plastic slabs while blindfolded. Another blindfold test had him guessing whether he was touching a real human hand or an artificial silicone one. The fourth and final test had him sort identical stainless steel cubes that were either hot or cold.
“Our goal is to develop a multimodal system that integrates touch, proprioception, and temperature sensations,” Solaiman Shokur, study author and neuroengineer at EPFL, says. “With that type of system, people will be able to tell you ‘this is soft and hot,’ or ‘this is hard and cold.’”
Getting back in touch (with touch)
How did he do? In all of the tasks, the participant scored better than chance.
He aced the bottle test with MindTouch turned on, scoring 100% accuracy. In the blindfolded tests, which looked toward more subtle temperature differences, he correctly discerned between the human and artificial hands 80% of the time and correctly differentiated between the various materials 67% of the time, and could easily distinguish between plastic and copper. Finally, over various sessions of block sorting, he correctly placed 114 out of 153 blocks for an accuracy of 64%.
In all of these tests, when MindTouch was turned off, his accuracy dropped to chance level. In the case of the bottle sorting test, it was only 33%.
We think having the ability to sense temperature will improve amputees’ embodiment — the feeling that “this hand is mine.”Solaiman Shokur
Interestingly, for two of the tests, bottle and materia sorting, he performed just as well with MindTouch as with his intact hand. The test where the prosthetic fell short by comparison was the handshake test; the researchers believe that other tactile sensations, such as skin texture, may have made the difference.
All told, the thermal sensations remained stable over 400 days, and because the device is noninvasive, no adverse effects were recorded.
“Adding temperature information makes the touch more human-like,” says senior author Shokur added. “We think having the ability to sense temperature will improve amputees’ embodiment — the feeling that ‘this hand is mine.’”
Moving forward, the team hopes to expand their studies to a larger cohort and determine how out-of-the-lab factors like air temperature and humidity affect MindTouch. They also note several challenges that will need to be overcome. Chief among these is devising a way to integrate multiple thermodes to evoke larger portions of someone’s phantom hand. They will also need to find a way to miniaturize the battery and controller unit to be more user-friendly.
“But these challenges are worth the effort,” the authors write, “as the long-term use of the thermal prosthetic hand could open completely new perspectives for prosthetic users. […] For the first time, we can envision the possibility of restoring a multimodal palette of natural sensations.”
Recent evidence suggests that among patients receiving vancomycin, receipt of concomitant piperacillin–tazobactam increases the risk of nephrotoxicity. Well-controlled, adequately powered studies comparing rates of acute kidney injury (AKI) among patients receiving vancomycin + piperacillin–tazobactam (VPT) compared to similar patients receiving vancomycin + cefepime (VC) are lacking. In this study we compared the incidence of AKI among patients receiving combination therapy with VPT to a matched group receiving VC.
Methods.
A retrospective, matched, cohort study was performed. Patients were eligible if they received combination therapy for ≥48 hours. Patients were excluded if their baseline serum creatinine was >1.2mg/dL or they were receiving renal replacement therapy. Patients receiving VC were matched to patients receiving VPT based on severity of illness, intensive care unit status, duration of combination therapy, vancomycin dose, and number of concomitant nephrotoxins. The primary outcome was the incidence of AKI. Multivariate modeling was performed using Cox proportional hazards.
Results.
A total of 558 patients were included. AKI rates were significantly higher in the VPT group than the VC group (81/279 [29%] vs 31/279 [11%]). In multivariate analysis, therapy with VPT was an independent predictor for AKI (hazard ratio = 4.27; 95% confidence interval, 2.73–6.68). Among patients who developed AKI, the median onset was more rapid in the VPT group compared to the VC group (3 vs 5 days P =< .0001).
Conclusion.
The VPT combination was associated with both an increased AKI risk and a more rapid onset of AKI compared to the VC combination.
Empiric antimicrobial therapy for the treatment of healthcare-associated infections frequently includes coverage for both methicillin-resistant Staphylococcus aureus and Pseudomonas aeruginosa. Common regimens include vancomycin in combination with an antipseudomonal b-lactam [1]. Piperacillin–tazobactam and cefepime are among the most common agents used for empiric antipseudomonal coverage.
A hospital’s selection of piperacillin–tazobactam vs cefepime as the “workhorse” antipseudomonal antibiotic has traditionally been based on institutional susceptibility trends, acquisition costs, and other formulary considerations. Concerns regarding nephrotoxicity have become increasingly prominent. While vancomycin has long been associated with acute kidney injury (AKI), recent evidence suggests that patients receiving combination therapy with piperacillin–tazobactam have a higher incidence of AKI compared to patients receiving vancomycin monotherapy [2] or those receiving combination therapy with vancomycin and cefepime (VC) [3].
However, the finding of increased toxicity in patients receiving vancomycin and piperacillin–tazobactam (VPT) combination therapy compared to VC has not been universal. A recent analysis showed no difference in AKI rates among intensive care unit (ICU) patients receiving either combination [4]. Prior studies have been limited by relatively small sample sizes, notable diversity in the patients receiving the different combination therapy regimens, and suboptimal study design.
In light of the conflicting results and methodological limitations of prior studies as well as the importance of clearly understanding whether or not combination therapy with VPT is associated with an increased AKI risk, this retrospective, matched, cohort study was designed to definitively address the following questions: is combination therapy with VPT associated with greater AKI risk compared to VC? If so, how much greater is the risk?
METHODS
Study Settings and Design
This was a retrospective, matched, cohort study that compared the incidence of AKI among patients on concomitant VC and those receiving VPT. The study was conducted at the Detroit Medical Center (DMC), a tertiary care health system in metropolitan Detroit, Michigan, comprised of 5 acute care hospitals with more than 2000 inpatient beds. The institutional review boards at the DMC and Wayne State University approved the study prior to initiation.
Study Population
The study population consisted of patients aged ≥18 years admitted to the DMC between 1 December 2011 and 31 December 2013. Patients included in the study received combination therapy with VC or VPT for ≥48 hours and had the 2 antibiotics initiated within 24 hours of one another. For patients who received combination therapy multiple times during hospitalization, only the initial regimen was included. Patients were excluded if the baseline serum creatinine was >1.2 mg/dL or they required renal replacement therapy at the time of initiation of combination therapy.
Patients were divided into 2 groups based on the combination regimen received. The patients in the VC group were matched to the VPT group on 5 variables associated with the development of AKI in a 1:1 ratio. The matching was performed based on severity of sepsis at the time that the combination antibiotics were started (dichotomized to presence or absence of severe sepsis/septic shock) [5], ICU status at onset of combination therapy, duration of combination therapy (divided into 3 categories: ≤3 days, 4–7 days, >7 days), the daily dose of vancomycin received (divided into 3 categories: < 2 grams/day, 2–4 grams/day, and >4 grams/day), and number of concomitant nephrotoxic agents received while on combination therapy.
Covariates Collected
Data abstracted from medical records included patient demographics; comorbidities, including Charlson comorbidity index [6]; severity of sepsis based on systemic inflammatory response syndrome criteria [5]; mechanical ventilation; infectious diagnosis; and receipt of concomitant nephrotoxins while receiving combination therapy. Antibiotic therapy variables collected included dose and duration of therapy. Vancomycin trough levels were also collected. Vancomycin loading dose was defined as an initial vancomycin dose that was higher than subsequent maintenance doses. The variables used for matching were extracted during the time period between 2 days prior and 2 days after initiation of combination therapy, with the highest values used for this purpose. Vasopressors, aminoglycosides, colistin, amphotericin B, angiotensin-converting enzyme inhibitors, angiotensin II receptor blockers, diuretics, and intravenous contrast were considered as nephrotoxic agents.
Vancomycin Trough Value Assessment
In order to assess the impact of vancomycin exposures on development of AKI, the median trough of vancomycin prior to AKI was calculated. For patients who did not develop AKI, median vancomycin troughs during the entire duration of combination therapy were analyzed, whereas among patients who developed AKI, only trough values obtained before the onset of AKI were included. Patients in whom trough values were not obtained during therapy and those who did not have trough values obtained prior to the development of AKI were excluded from trough analyses.
Acute Kidney Injury Definitions
Determination of AKI was based on 3 definitions: According to the RIFLE (Risk, Injury, Failure, Loss, End Stage Renal Disease) criteria [7], the Acute Kindey Injury Network (AKIN) criteria [8], and vancomycin consensus guideline definition [9]. For RIFLE criteria, the terms risk, injury, and failure were defined as follows: risk, a rise in creatinine by 1.5 times baseline or a decrease in glomerular filtration rate (GFR) by 25%; injury, a rise in creatinine of 2 times baseline or a decrease in the GFR by 50%; and failure, a rise in creatinine by 3 times baseline or a GFR decrease by 75%. AKIN criteria were categorized into 3 stages: a rise in creatinine by 1.5-fold or 0.3 mg/dL was categorized as stage 1, a 2-fold rise in creatinine was categorized as stage 2, and a rise in creatinine by 3-fold or ≥ 4 mg/dL or initiation of renal replacement therapy was categorized as stage 3. For the vancomycin consensus guidelines, AKI was defined as a rise in baseline serum creatinine by ≥50% or >0.5 mg/dL sustained over at least 2 consecutive measurements ranging from the time of initiation until 72 hours post-completion of vancomycin therapy. RIFLE-defined AKI was used for all multivariate analyses, where meeting any stage of the RIFLE criteria was considered AKI.
Statistical Analyses
All statistical analyses were performed using SAS software, version 9.3 (Cary, North Carolina). Matched bivariate analyses comparing patients receiving VC to patients receiving VPT were conducted using conditional logistic regression modeling. For bivariate unmatched analysis, Fisher exact test and χ2 test were used to analyze dichotomous variables, and Student t test and Wilcoxon rank-sum test were used for continuous variables.
To determine the impact of VPT on AKI risk in both bivariate and multivariate analyses, Cox proportional hazards methodology was used. In multivariate analysis to control for residual differences between the VPT and VC groups, all variables with a P value <.1 in the bivariate matched analysis comparing VPT and VC groups were included, along with treatment group (VPT vs VC), in a multivariate model for AKI. In this model the event of interest was development of RIFLE-defined AKI. All P values were 2 sided and a P value <.05 was considered statistically significant. Crude rates of AKI of the 2 study groups were compared using a Kaplan–Meier curve and the log-rank test.
RESULTS
Baseline Characteristics
A total of 320 patients who received VPT and 803 patients who received VC during the study period were identified. Of the 320 VPT patients, adequate VC matches were identified for 279. Thus, 279 VPT–VC pairs were included in the final study population, for a total of 558 patients. The mean age was 55.9 ± 16.6 years. Patients in both VC and VPT groups had similar baseline characteristics in terms of age, length of ICU stay, Charlson comorbidity index score, baseline creatinine, and use of concomitant nephrotoxins (Table 1). There were more females in the VC group, and more patients were white in the VPT group. Patients were more likely to have had connective tissue disease and hypertension in the VC group compared to those in the VPT group. Patients in the VPT group had a higher incidence of septic shock and skin and soft tissue infections. Combination therapy with both VPT and VC was initiated as empiric therapy in all patients. There were no differences in the number of patients receiving vancomycin loading doses, the median loading or maintenance doses of vancomycin given, or the median vancomycin trough values between the 2 groups.
Table 1.
Baseline Characteristics of Cohort Comparing Patients Receiving Vancomycin and piperacillin–Tazobactam Combination to Patients Receiving Vancomycin–Cefepime Combination
Variable
Vancomycin–Cefepime n = 279 (%)
Vancomycin and Piperacillin–Tazobactam n = 279 (%)
Odds Ratio (95% Confidence Interval)
P Value
Age, ya
56.5 ± 16.4
55.3 ± 16.8
.39
Female
153 (55)
128 (46)
0.69(0.50–0.97)
.034
Race
<.0001
White
56 (20)
93 (33)
.0005
Black
191 (68)
175 (63)
Others
32 (11)
11 (4)
1.98 (1.35–2.92)
Admission source
226 (81)
242 (87)
1.53 (0.97–2.42)
.005
Home
30 (11)
31 (11)
.07
Nursing home
23 (8)
6 (2)
Other hospital
226 (81)
242 (87)
Height, cma
170 ± 10
171 ± 11
.34
Median weight, kg
74 (63.8–90)
78.4 (66–95)
.42
Median body mass index, kg/m2
25 (21.4–30.3)
26.5 (22.5–31.7)
.55
Comorbid conditions
Myocardial Infarction
24 (9)
13 (5)
0.52 (0.25–1.04)
.06
Congestive heart failure
36 (13)
34 (12)
0.94 (0.56–1.55)
.79
Peripheral vascular disease
26 (9)
30 (11)
1.17 (0.67–2.04)
.57
Dementia
32 (11)
23 (8)
0.69 (0.39–1.22)
.20
Chronic pulmonary disease
79 (28)
82 (29)
1.05 (0.73–1.52)
.78
Connective tissue disease
22 (8)
10 (4)
0.43 (0.20–0.94)
.03
Chronic kidney disease
10 (4)
5 (2)
0.49 (0.16–1.45)
.19
Malignant solid tumor
51 (18)
40 (14)
0.75 (0.47–1.17)
.20
Cerebrovascular disease
42 (15)
29 (10)
0.65 (0.39–1.08)
.10
Liver disease
9 (3)
15 (5)
1.70 (0.73–3.96)
.21
Diabetes mellitus
62 (22)
69 (24)
1.15 (0.77–1.70)
.48
Hypertension
177 (63)
149 (53)
0.66 (0.47–0.93)
.02
Median Charlson comorbidity index (IQR)
1 (0–3)
1 (0–3)
.21
Hospital and infection-related variables
Systemic inflammatory response syndrome criteriab
No sepsis
44 (16)
52 (19)
Sepsis
166 (60)
159 (57)
Severe sepsis
62 (22)
48 (17)
Septic shock
7 (3)
20 (7)
Any sepsis
235 (84)
227 (81)
0.82 (0.53–1.27)
.37
Severe sepsis/septic shock
69 (25)
68 (24)
0.98 (0.66–1.44)
.92
Intensive care unit stay b
63 (23)
58 (21)
0.90 (0.60–1.35)
.61
Mechanical ventilation b
43 (15)
44 (16)
1.03 (0.65–1.62)
.91
Median white blood cell count b >10
11.3 (7.7–15.5) 166 (60)
10.5 (7.4–14.4) 146 (52)
0.74 (0.53–1.04)
.06 .08
Mean baseline creatininea
0.86 ± 0.20
0.86 ± 0.21
.64
Median length of stay before combination therapy (IQR)
0 (0.0–3.0)
0 (0.0–2.0)
.63
Infection type and diagnosis
Physician-diagnosis with positive culture
86 (31)
91 (33)
1.08 (0.76–1.55)
.65
Pneumonia
12 (4)
14 (5)
1.17 (0.53–2.59)
.68
Endocarditis
4 (1)
2 (1)
0.49 (0.09–2.73)
.42
Intraabdominal infection
5 (2)
9 (3)
1.82 (0.60–5.51)
.28
Skin/soft tissue infection
21 (8)
37 (13)
1.88 (1.07–3.29)
.02
Bone/joint infection
19 (7)
16 (6)
0.83 (0.42–1.65)
.60
Urinary tract infection
11 (4)
8 (3)
0.72 (0.28–1.82)
.48
Bacteremia
22 (8)
25 (9)
1.15 (0.63–2.09)
.65
Catheter-associated bloodstream infection
6 (2)
2 (1)
0.33 (0.06–1.64)
.17
Other/unknown
4 (1)
3 (1)
0.75 (0.16–3.37)
.70
Invasive infectionc
35 (13)
32 (12)
0.90 (0.54–1.50)
.69
Polymicrobial infection
36 (13)
40 (14)
1.13 (0.69–1.83)
.62
Pathogens
Gram-positive bacteria
50 (18)
60 (22)
1.25 (0.83–1.90)
.28
Methicillin-resistant Staphylococcus aureus
23 (8)
16 (6)
0.68 (0.35–1.31)
.25
Methicillin-susceptible Staphylococcus aureus
7 (3)
14 (5)
2.05 (0.81–5.15)
.13
Gram-negative bacteria
51 (18)
43 (15)
0.81 (0.52–1.27)
.37
Pseudomonas
5 (2)
13 (5)
2.67 (0.94–7.59)
.06
Enterobacteriaceae
48 (17)
31 (11)
0.60 (0.37–0.97)
.04
Concomitant nephrotoxins
Median number of nephrotoxins (IQR)
1 (0–2)
1 (0–2)
0.98 (0.82–1.17)
.86
Vasopressors
9 (3)
16 (6 )
1.82 (0.79–4.20)
.16
Aminoglycoside
10 (4)
16 (6)
1.64 (0.73–3.67)
.23
Colistin
7 (3)
2 (1)
0.28 (0.06–1.36)
.12
Angiotensin converting enzyme inhibitors/ angiotensin II receptor blockers
76 (27)
70 (25)
0.89 (0.61–1.30)
.56
Diuretics
78 (28)
75 (27)
0.95 (0.65–1.37)
.78
Intravenous contrast
76 (27)
74 (27)
0.96 (0.66–1.40)
.85
Vancomycin dosing and monitoring
Loading dose given
237 (85)
233 (84)
0.89 (0.57–1.42)
.64
Loading dose, mga
1544.8 ± 762.3 (n = 237)
1610.2 ± 827.6 (n = 233)
.12
Vancomycin dose a
2818 ± 1202
2968 ± 1320
.21
Median trough before AKId (IQR)
17.7 (13.4–20.9)
17.3 (12.6–21.6)
.98
MT before AKI >15d
160 (68) n = 236
146 (65) n = 225
.55 .55
MT before AKI >20d
77 (33) n = 236
80 (27) n = 225
Statistically significant values are shown in bold.
aData are presented as mean ± standard deviation. The vancomycin maintenance dose listed is the first maintenance vancomycin dose, as subsequent doses were based on serum concentrations.
b Variables such as systemic inflammatory response syndrome criteria, intensive care unit stay, mechanical ventilation, and wild blood cell count were assessed during a window period of 2 days prior to and 2 days after initiation of combination therapy.
c Invasive infections were defined as presence of pneumonia or endocarditis or bone/joint infection.
d Data based on median troughs before AKI in patients with AKI and includes median troughs for entire duration of therapy in patients without AKI.
The rate of AKI was higher among patients receiving VPT compared to those receiving VC combination therapy. Based on RIFLE criteria, 81 patients in the VPT group developed AKI compared to 31 patients in the VC group (29.0% vs 11.1%; hazard ratio [HR] = 4.0; 95% confidence interval [CI], 2.6–6.2; P < .0001). Rates of AKI were also higher per AKIN criteria (32% in the VPT vs 14% in the VC group; HR = 3.5; 95% CI, 2.3–5.2; P < .0001) and per vancomycin consensus guidelines definition (24% in VPT vs 8.2% in VC; HR = 4.4; 95% CI, 2.7–7.3; P < .0001). In multivariate analysis, after controlling for residual differences between the VPT and VC groups (race, gender, admission from home, comorbid conditions, presence of septic shock, baseline serum white blood cell count, and source of infection), VPT was independently associated with RIFLE-defined AKI (HR = 4.3; 95% CI, 2.7–6.7; P < .0001).
Characterization of AKI
Of the patients who developed RIFLE-defined AKI (n = 31 in the VC group and n = 81 in the VPT group), the onset of AKI was more rapid in patients receiving VPT. The median duration of combination therapy prior to development of AKI was 5 days (interquartile range [IQR], 3–7 days) in the VC and 3 days (IQR, 2–5 days) in the VPT group; P < .0001. Survival curves depicting time to AKI in the 2 treatment groups were constructed (Figures 1 and 2) and demonstrate the increased incidence and more rapid onset of AKI among patients in the VPT group compared to those in the VC group (P < .0001). Importantly, the Kaplan–Meier curves also show that the daily rate of AKI among at-risk patients remained consistently higher in the VPT group compared to the VC group throughout the entire first week of combination therapy.
Comparison of cumulative rates of acute kidney injury in patients receiving combination therapy with vancomycin–cefepime and those receiving vancomycin and piperacillin–tazobactam. Abbreviations: AKI, acute kidney injury; VC, vancomycin–cefepime; VPT, vancomycin and piperacillin–tazobactam.
a Controlling for race, gender, admission from home, comorbid conditions, baseline serum white blood cell count >10, 000/µL, and source of infection being skin or soft tissue.
The median length of stay after initiation of combination therapy was longer for VPT patients compared to VC patients (8 days vs 6 days; P = .01). There was no difference in mortality between the 2 groups.
Impact of Vancomycin Troughs on AKI
Although there were no differences in median vancomycin trough values or the number of patients who had troughs >15 mg/L or >20 mg/L between the VC and VPT groups, additional analyses were performed to further assess the impact of vancomycin trough on incidence of AKI (Figures 3a, 3b). Interestingly, when the trough was dichotomized, there was no association between vancomycin trough and AKI for patients in the VPT group (trough <15 mg/L or ≥15 mg/L). Additionally, there was no association when troughs were categorized into 3 ascending groups: <15, 15–20, or >20 mg/L.
A, Acute kidney injury (AKI) rates as a function of vancomycin troughs. B, AKI rates in patients with median troughs <15 mg/L vs ≥ 15 mg/L.
Abbreviations: AKI, acute kidney injury; NA, not applicable; VC, vancomycin–cefepime; VPT, vancomycin and piperacillin–tazobactam.
Conversely, a direct relationship was seen between vancomycin trough and AKI among patients in the VC group. When the vancomycin troughs were dichotomized, AKI occurred in 1/76 (1%) patients with median trough values <15 mg/L vs 20/160 (13%) of patients with values ≥15 mg/L; P = 003. Additionally, when vancomycin troughs were analyzed in ascending categories, a significant association was also seen. AKI occurred in 1% of patients with troughs <15 mg/L, in 5% (4/83) of patients with troughs of 15–20 mg/L, and in 21% (16/77) of patients with median troughs >20 mg/L. AKI rates among patients in the VC group were significantly different when patients with troughs of <15 mg/L were compared to patients with troughs >20 mg/L (P = .0001) and when patients with vancomycin troughs of 15–20 mg/L were compared to patients with troughs >20 mg/L (P = .003).
DISCUSSION
Rates of AKI among patients receiving VPT were approximately 3 times greater than rates in patients receiving VC, regardless of type of AKI definition used. In multivariate modeling and controlling for residual differences between these 2 closely matched groups, receipt of VPT was associated with a greater than 4-fold increased risk of AKI. These findings are particularly robust and convincing as, unlike previous analyses comparing toxicity risk in patients on VPT and VC, this analysis was adequately powered and groups were matched on 5 widely recognized risk factors for AKI in patients receiving vancomycin.
These findings are strengthened by 3 additional important and notable findings. First, among patients who developed AKI, the onset was more rapid in VPT patients compared to VC patients (3 days vs 5 days; P < .0001.) Second, the daily rate of AKI among the at-risk population remained higher throughout the first week of therapy among VPT patients. This rapid onset and persistently increased AKI risk are both consistent with VPT being more toxic than VC.
The third finding supporting an association between VPT and increased toxicity was both interesting and unexpected. Data from this study show discordance in the impact of vancomycin troughs on toxicity in patients receiving VPT compared to those receiving VC. Among patients receiving VPT, there was no discernable impact of vancomycin trough on the incidence of AKI. Conversely, a distinct trough–toxicity association was noted in patients receiving VC. These discordant trough associations strengthen the finding that the VPT combination was a significant driver of AKI. These data suggest that the concomitant use of VPT had such a nephrotoxic effect that it muted the impact of vancomycin trough concentrations on AKI. However, when patients received VC (and the toxic effect of VPT was not present), the association between vancomycin troughs and AKI was apparent. These findings could help to explain the discordant literature with respect to the impact of vancomycin trough on AKI, as the type of concomitant antipseudomonal therapy received by patients is rarely reported, let alone controlled for. Of note, the associations between vancomycin trough and AKI are particularly robust, as only trough values obtained before the onset of AKI were included. Because elevated vancomycin troughs that occurred as a result of AKI were excluded, the association between vancomycin trough and AKI was unbiased.
The findings of this study are largely consistent with those found in other studies that analyzed comparative AKI risks of VPT and VC. In a smaller analysis, Gomes and colleagues demonstrated similar findings, with 35% of VPT and 13% of VC patients developing AKI [3]. In a propensity score-matched subgroup, VPT was independently associated with increased AKI risk (OR, 5.67; 95% CI, 1.66–19.33). Similarly, in an analysis that was conducted to assess the impact of generic vancomycin product on development of AKI, Sutton and colleagues reported concomitant VPT to be the strongest predictor of AKI in the cohort (OR, 3.97; 95% CI, 1.66–9.50) [11].
However, the association between VPT and AKI is not a universal finding. Although Moenster and colleagues reported that AKI occurred in 29% of patients on VPT and 13% of patients on VC, this difference failed to reach statistical significance (OR, 3.45; 95% CI, 0.96–12.4) [12]. Importantly, the study was underpowered, and numerically these findings are consistent with those from the aforementioned studies. Hammond and colleagues also recently analyzed comparative toxicity rates in an ICU population. In their analysis AKI was reported in 33% of patients on VPT and 29% of patients on VC; P = .65 [4]. It warrants mention that this study was powered to detect a difference in AKI rates of 36.5% vs 15% in the 2 groups and therefore was underpowered to identify more subtle differences in AKI rates, particularly in an ICU population with competing AKI risks.
The data presented here are robust, overcome several limitations found in the previous literature, and convincingly demonstrate that, compared to VC, combination therapy with VPT is associated with a higher overall incidence of AKI, a more rapid onset of AKI, and a persistently increased daily AKI risk throughout the first week of therapy. Despite the robustness of our methodology, there are a few limitations. This was a single-center, retrospective analysis and is thus subject to the inherit biases associated with this type of study design, and the results should be confirmed in other patient populations. In addition, only approximately 20% of patients in this study were cared for in the ICU; therefore, the results might not be generalizable to the ICU patient population. Furthermore, while the definition of combination therapy used in this manuscript is rational (≥48 hours of combination therapy where each agent was started within 24 hours of the other), definitions used by investigators in other analyses differ slightly (ranging from a requirement of administration of the combination for ≥48–72 hours, with or without the requirement that the agents were started within 48 hours of one other). However, these relatively minor differences are unlikely to explain differences between the findings presented here and those in prior publications. Finally, we chose to exclude patients with baseline renal insufficiency. Patients with baseline renal insufficiency represent an important patient population at risk for developing AKI and warrant evaluation in future studies.
In conclusion, combination therapy with VPT was independently associated with a 4-fold increased risk of AKI compared to combination therapy with VC. Additionally, AKI with VPT occurred in a more rapid fashion. Despite this rapid onset of AKI, there are opportunities for providers to limit the incidence of this adverse event. Data recently published by our group [10] demonstrated that the highest daily incidence of AKI among patients receiving VPT occurred on day 4 and day 5 of therapy. Therefore, timely de-escalation or discontinuation of 1 or both of the combination agents would likely mitigate AKI risk. However, given the association between VPT and increased AKI risk, it is critical that clinicians consider all risks and benefits of therapy (both efficacy and toxicity) when selecting empiric combination regimens. Clinicians might choose an alternative to piperacillin–tazobactam in settings where vancomycin is coadministered. If antibiogram data demonstrate an advantage with regard to activity against likely gram-negative pathogens of empiric piperacillin–tazobactam, clinicians might combine piperacillin–tazobactam with an alternative gram- positive agent. Because overuse of vancomycin alternatives might be concerning from a stewardship perspective, one approach might be to limit use of combination therapy with vancomycin alternatives and piperacillin–tazobactam to patients who are hemodynamically unstable and thus more likely to be significantly harmed by ineffective empiric gram-negative coverage, while using vancomycin plus cefepime in more stable patients.
If you’re suffering with bleeding gums, you may be wondering what are the best foods that help bleeding gums and why? Generally speaking, an organic (chemical free) diet and exercise are essentials for a healthy body, mind and spirit. But, today, we want to focus on certain foods that will greatly improve your oral health.
Foods that help bleeding gums
There are many foods that help bleeding gums heal. Gums that are healthy and well-nourished have less chance of bleeding. When it comes to healthy diets, fresh and organic fruits and vegetables are great options for preventing and resolving bleeding gums.
But how do you decide which ones to include in your daily routine?
Foods that help bleeding gums include those that:
Are rich in vitamin C
Contain beta-carotene and vitamin A
Are high in omega-3s
Contain high levels of B vitamins
Contain probiotics
Read on to discover which foods you should include in your diet to help heal your bleeding gums. And which types of foods you should avoid to keep your mouth in top shape.
Vitamin C-rich foods that help bleeding gums
Vitamin C is one of the most essential vitamins to include in your diet. This vitamin helps to increase collagen and also acts as an anti-inflammatory agent to help reduce the pain and swelling that often occurs with gum disease.
According to researchers, people with bleeding gums often lack vitamin C, so adding more of this essential vitamin to your diet can help you avoid the pain associated with gingivitis.
Vitamin C-containing foods that help bleeding gums include:
BerriesBerries are a great food to eat if you have gum disease. Berries have a high amount of vitamin C, which can be very beneficial for your oral health.Berries, such as blueberries, raspberries, black and red currants, and strawberries, are all packed with antioxidants, fiber, and other important nutrients that can help to prevent gum disease as well as tooth decay.
Cranberries Yes, cranberries are a type of berry. But this superfood has so many amazing nutrients that help bleeding gums, they deserve to be listed by themselves.Not only are cranberries high in vitamin C — one cup of raw cranberries has a whopping 25% of your daily requirement — but they also contain manganese, copper, iron, calcium, and vitamins A, K, E, and B-complex vitamins.Be sure you are choosing organic, fresh, or dried cranberries. Stay away from products such as canned cranberry sauce and juice cocktails because they contain a lot of added sugar which will negatively impact your oral health.
Bell peppersWhen you’re looking for foods that help bleeding gums, bell peppers are a great addition to your diet.Both red and green organic bell peppers are excellent sources of vitamin C. Nearly 300% of your daily vitamin C needs can be found in just one cup of red bell peppers. Green bell peppers, on the other hand, contain 130% of the daily recommended intake of vitamin C.
Foods with beta-carotene and vitamin A
Beta-carotene plays an important role in keeping your gums healthy. It reduces inflammation and provides your body with the elements it needs to create vitamin A.
When choosing foods that help bleeding gums, look for those that are high in beta-carotene and vitamin A.
Vitamin A can help prevent gum disease through its anti-inflammatory properties. The vitamin A content in organic vegetables can also keep your teeth and gums strong and healthy by promoting the growth of new tissues.
Dark leafy greens
When you think of beta-carotene, you may think of orange-colored vegetables. But it’s also found in dark green vegetables as well.
Dark leafy greens such as organic spinach, kale, Swiss chard, turnip greens, and collard greens are rich in beta-carotene, vitamin A, and vitamin C, making them among the best foods that help bleeding gums.
These greens are easy to incorporate into your diet and can be added to salads, sandwiches, soups, and smoothies.
Dark leafy greens are also rich in iron, which is another important mineral to have in your diet if you suffer from gum disease. Iron helps you produce red blood cells, which are responsible for transporting oxygen throughout your body.
Sweet potatoes
Sweet potatoes — and yams — are great anti-inflammatory foods that help bleeding gums. Organic sweet potatoes are an excellent source of many nutrients, including beta-carotene, magnesium, vitamin B6, and vitamin C — all of which help improve oral health.
Carrots
Carrots are another great source of beta-carotene. One cup of cooked carrots has 120% of your recommended daily allowance.
Because carrots — and sweet potatoes — are root vegetables, it is especially important to buy organic as they are more likely to absorb any chemicals in the soil they grow in.
High omega-3 fatty acid foods that help bleeding gums
Omega-3 fatty acids are another essential nutrient for maintaining healthy gums. These fatty acids are found in foods such as wild-caught fish, organic walnuts, almonds, and avocados.
Omega-3 fatty acids have been shown to be effective at reducing gum inflammation and can help to prevent gum disease. Eating these fatty acids regularly can not only help to improve your oral health but your overall health as well.
Omega-3 fatty acids can also improve the health of your teeth and gums by promoting the formation of new and healthy tissues.
Don’t forget to consume some high quality seafood
Fish and other seafood are excellent sources of omega-3s. Especially fatty fish found in cold waters, such as salmon, herring, sardines, and mackerel.
These fish have high amounts of EPA and DHA omega-3 fatty acids. Both have anti-inflammatory effects on the body and are great for the immune system. DHA is especially beneficial for oral health.
Nuts and seeds
Organic nuts and seeds are rich in healthy fats and minerals that can promote healing in your gums. They are also very high in omega-3 fatty acids, which reduce inflammation and promote healthy gums.
Nuts and seeds are also excellent sources of protein, which can help keep your teeth strong. Strong teeth are less susceptible to tooth decay and gum disease.
The only (minor) downside to eating nuts and seeds is that they potentially have sharp or rough edges, which can irritate gum tissues. Just be careful to chew well.
Foods rich in B vitamins to help bleeding gums
B vitamins can help restore normal gum tissue, which can be very beneficial for people with gum disease. B vitamins can also help lower your homocysteine levels, which is an amino acid that is linked to an increased risk of gum disease.
Beans
Organic beans have a long history as part of a healthy diet. They have been linked to a reduced risk of many diseases, including heart disease and diabetes. Beans are also naturally linked to better oral health.
Beans such as black beans, pinto beans, and chickpeas are high in B vitamins. They are rich in fiber, Vitamin B6, folate, and minerals such as iron and magnesium. All these contribute to better gum health making them good foods that help bleeding gums.
Beans are very easy to cook and can be served as a side dish or added to salads. They are also very affordable and can be easily purchased in bulk to save money.
Foods that help bleeding gums heal should contain natural probiotics
In recent years, researchers have been studying how probiotics may be beneficial in treating oral infections. Probiotics are the good bacteria found in certain foods which help keep the microbes in your body in balance.
When the bacteria in your mouth become unbalanced due to poor hygiene or other factors, foods that naturally contain probiotics can help with bleeding gums and other oral health concerns.
Raw yogurt and kefir
Both yogurt and kefir are fermented dairy products. Each is loaded with beneficial probiotics that can help support your overall health, including helping to maintain healthy gums.
The helpful bacteria in yogurt and kefir can reduce the growth of certain bacteria that cause gum disease and cavities.
However, be aware that not all yogurt contains probiotics. Read the labels and choose ones with live, organic and active cultures.
Fermented vegetables
Fermented foods such as non-GMO organic tempeh, raw sauerkraut, fermented pickles, miso, and kimchi are made from vegetables such as cabbage, soybeans, radishes, and cucumbers. The fermentation process is a way of preserving food that adds healthy bacteria or probiotics.
Often store-bought items such as sauerkraut or pickles have been processed in such a way that they no longer contain probiotics. Look for traditional foods that say they are fermented and require cool storage or refrigeration.
Fermented tea
Kombucha is green or black tea that has been fermented. Originally a traditional drink from China, it has gained in popularity worldwide.
The probiotics in this lightly fizzy and tangy drink are good not only for oral health but for balancing healthy gut bacteria and aiding digestion.
Foods to avoid
Just as there are foods that help bleeding gums, there are certain ones to avoid.
Starchy or processed foods can contribute to gum inflammation. These types of foods stick to teeth and break down into sugars.
Sugar is well-known to contribute to gum disease and cavities. The sugar feeds the bacteria that cause plaque which then leads to swollen and bleeding gums and eventually gum disease.
Watch out for sugary foods such as candy, chocolate, applesauce, white bread, pasta sauce, sports drinks, and sodas. Sugar is in more things than you may realize!
If you have gum disease, acidic foods are another type to avoid. They will irritate and make your bleeding gums worse. Foods with high acid contents include citrus fruits and juices, tomatoes, black coffee, and tea.
Heal bleeding gums the natural way
By making a few simple changes to your diet, you can greatly improve your oral health and help your bleeding gums improve.
Fresh organic vegetables and fruit, dark leafy greens, berries, beans, nuts and seeds, whole grains, and omega-3 fatty acids are all foods that help bleeding gums and are great foods to add to your diet.
Did you know that up to 80% of disease symptoms are triggered by problems in the mouth? Find out how you can reverse gum disease and fix problems in the mouth naturally from many of the finest holistic doctors in the world.
In the last few years, major strides have been made in the fight to control malaria, including the first two malaria vaccines ever recommended for use.
“As a malaria researcher, I used to dream of the day when we would have a safe and effective vaccine against malaria. Now we have two,” WHO Director-General Tedros Adhanom Ghebreyesus, PhD, MSc, said during a press briefing in October after WHO recommended the second vaccine.
Although the successful development and subsequent rollout of these vaccines is seen as a major advancement in the fight against malaria, experts cautioned that there is still much left to do to achieve the goal of significantly reducing the burden of a disease that kills more than 600,000 people globally each year.
We checked in with some experts to get their feedback on the vaccines and where the world stands in its fight against malaria.
‘An incredible moment’
In October 2021, WHO recommended the widespread use of a malaria vaccine for the first time for children in sub-Saharan Africa and other areas heavily impacted by the mosquito-borne disease.
The vaccine, RTS,S/AS01, protects against Plasmodium falciparum — the most deadly of the five species of malaria parasites that infect humans, and the most common cause of the disease in Africa.
Ashley Birkett
The announcement was a long time coming since researchers first determined that a malaria vaccine was biologically possible, said Ashley Birkett, PhD, global head for malaria vaccines and biologics at PATH.
“It took about 50 years,” Birkett told Healio | Infectious Disease News.
WHO’s recommendation was based on data from a pilot program called the Malaria Vaccine Implementation Program, which has delivered the vaccine to nearly two million children in Ghana, Kenya and Malawi since 2019. As part of the program, children received four doses of the vaccine — the first three between age 5 to 9 months, and the fourth dose around age 2 years.
According to WHO, the program demonstrated that the vaccine was safe and feasible to deliver and reduced severe malaria by 30% and all-cause deaths by 13%, even in areas where insecticide-treated bed nets are widely used and people have good access to malaria care.
Additional data from a phase 3 study published in The Lancet Infectious Diseasesthis past August demonstrated that seasonal vaccination with RTS,S/AS01, in combination with seasonal chemoprevention with sulfadoxine-pyrimethamine plus amodiaquine, reduced hospitalizations and deaths from malaria by around two-thirds among children in two African countries, Burkina Faso and Mali.
Rollout of the vaccine has continued to expand. In July, WHO announced that 12 African countries — Benin, Burkina Faso, Burundi, Cameroon, the Democratic Republic of the Congo, Ghana, Kenya, Liberia, Malawi, Niger, Sierra Leone and Uganda — will receive 18 million doses of the vaccine beginning in the last quarter of this year, with the first doses to be prioritized for children who are at the highest risk for dying from malaria.
WHO, UNICEF and Gavi, the Vaccine Alliance said they expect GSK to produce approximately 15 million doses of the vaccine per year from 2026 through 2028.
WHO recommended the second vaccine — R21/Matrix-M — in October after clinical trial data showed it reduced symptomatic cases of malaria by 75% during the 12 months following a three-dose series in areas with high seasonal malaria transmission. A fourth dose given a year after the third maintained that efficacy, study data published in September 2022 showed, making it the first vaccine to meet WHO’s Malaria Vaccine Technology Roadmap goal of a vaccine with at least 75% efficacy.
However, because the vaccines were studied in different populations, it is not clear if one is more effective than the other, according to Philip J. Rosenthal, MD, professor of medicine at the University of California, San Francisco. In fact, RTS,S has demonstrated a similar effectiveness to the R21 vaccine in similar settings, according to PATH.
Philip J. Rosenthal
“We’ve been hoping for a malaria vaccine for many decades. In fact, the path to these vaccines started in the 1960s with the initial basic research that led to our understanding of the value of this vaccine approach,” Rosenthal told Healio | Infectious Disease News. “It’s very exciting that we have vaccines for any parasitic disease. However, as is much discussed, the efficacy is much lower than what we see for most vaccines.”
According to Stephen Sosler, PhD, MPH, anepidemiologist and head of vaccine programs at Gavi, the next step for R21/Matrix-M is WHO prequalification, which will allow for it to be distributed on a large scale globally. (GSK’s vaccine received prequalification last year.) Once that happens, national immunization programs can decide on its use, enabling organizations such as Gavi to help them acquire and roll out the vaccine.
According to Sosler, it is estimated that malaria vaccines could prevent one death for every 200 children who are vaccinated.
“This is an incredible moment in the fight against malaria,” Sosler said. “We are close to unleashing not one, but two vaccines against a disease that kills half a million children in Africa each year. This is a game-changer for the continent, which has 96% of the global disease burden.”
The vaccines are unique because they protect against a parasite — “a complex organism with a lifecycle of its own” — rather than a virus or bacterium, Birkett said.
“The malaria parasite has more than 5,000 genes, which makes identifying the disease-causing gene or protein very difficult,” he said. “[These] are the first vaccines against a human parasite. There are many vaccines against viruses, far fewer against bacteria, but when it comes to parasites, the only success in terms of a vaccine for people has been against malaria.”
The two vaccines are similar, but not identical, according to Rosenthal, who explained that both use the same surface antigen — the circumsporozoite protein — but different adjuvants to boost immune responses.
Sir Brian Greenwood
“There is so far no evidence that one vaccine is much better than the other,” Sir Brian Greenwood, CBE, FRS, FMedSci, professor of clinical tropical medicine at the London School of Hygiene & Tropical Medicine, told Healio | Infectious Disease News. “However, the advantage that R21 has over RTS,S is that it is manufactured by the Serum Institute of India, which can produce it rapidly at scale whilst GSK, the manufacturer of RTS,S, can only produce limited supplies.”
That advantage was also noted by Kate O’Brien, MD, MPH, director of WHO’s Department of Immunization, Vaccines and Biologicals, during the press conference after WHO announced that it was recommending the second vaccine.
“We have only 18 million doses of RTS,S through the end of 2025, with work going on to increase that supply,” O’Brien said. “With R21 coming in and commitments from the manufacturer [to have] over 100 million doses per year, this is a very big step toward access.”
R21 will cost $2 to $4 per dose, keeping its cost-effectiveness in line with other recommended malaria interventions and other childhood vaccines, WHO said. According to UNICEF, the GSK vaccine is expected to cost more than $9 per dose from 2023 to 2025.
Sosler said R21 has the chance to “significantly alleviate supply constraints, enabling us to meet high demand in malaria-endemic countries.”
“The availability of the two vaccines will necessitate a strategic shift,” he said. “The addition of R21 allows for new approaches — smaller countries might exclusively scale up with RTS,S, whereas populous nations like Nigeria could opt for R21.”
The total cost of vaccination programs may be complicated by questions about dosing. Greenwood noted that the vaccines provide a relatively short period of high protection without the addition of a booster or repeat doses and that it is not yet known how frequently someone might need these.
“One might say this is like a polio vaccine, but the polio vaccine, I think, was much more important for the control of polio than the malaria vaccines are going to be in controlling malaria,” Rosenthal said. “This is one important tool, but it’s probably not a game-changer.”
‘Not a silver bullet’
It will be important to deploy vaccines in conjunction with other proven prevention methods, experts agreed.
“Vaccination is not a silver bullet. It must be used alongside existing malaria interventions such as insecticide-treated nets, indoor residual spraying, intermittent preventive treatment in pregnant women, use of antimalarials, plus effective case management and treatment,” Sosler said. “The wide range of nonvaccine interventions deployed since 2000 have helped reduce deaths by a third and their importance cannot be overstated.”
Indeed, some of the most effective tools against malaria have been the ones used to control the mosquitoes themselves, including insecticide-treated bed nets.
A 2-decade study published earlier this year found that the benefits of using treated bed nets for malaria control early in childhood persisted into adulthood, assuaging concerns that malaria control in early childhood with treated bed nets “might delay the acquisition of functional immunity and shift child deaths from younger to older ages,” researchers wrote in The New England Journal of Medicine.
Results from the 22-year cohort study, which was conducted in Tanzania, found that participants who reported during at least half of community outreach visits early in their life that they used treated nets had a 43% lower risk for death compared with participants who reported using treated nets at less than half the visits.
This “suggests that the survival benefits of insecticide-treated nets were large and persisted to adulthood given a moderate level of community coverage,” the researchers wrote.
“Before the evidence came in, many doubted that [treated bed nets] could have such a tremendous impact on malaria, but they did,” Birkett said.
More than 2 billion bed nets have been distributed worldwide since 2005. Over the years, however, mosquitoes have become resistant to pyrethroids, the primary insecticide used to treat the nets. In response, in 2017, WHO recommended also treating them with piperonyl-butoxide, a chemical that enhances the potency of pyrethroids against resistant mosquitoes.
New recommendations published by WHO earlier this year included two new classes of dual-ingredient bed nets — pyrethroid-chlorfenapyr nets to enhance the killing effect of the net, and pyrethroid-pyriproxyfen nets,which disrupt mosquito growth and reproduction.
“These new types of nets were designed to have a greater impact against pyrethroid-resistant mosquitoes,” Jan Kolaczinski, PhD, head of the Vector Control and Insecticide Resistance unit of WHO’s Global Malaria Program, said at the time. “By including two active ingredients in an [insecticide-treated net], the likelihood of mosquitoes being resistant to both is greatly reduced.”
Additionally, drugs to prevent malaria have been routinely prescribed for travelers. Recommendations for which drug to choose depends on where a person is traveling, the CDC notes. The drugs include atovaquone/proguanil, chloroquine, doxycycline, mefloquine, primaquine and tafenoquine.
For decades, the only cases of malaria treated in the United States were related to travel. That changed this year when Florida and Texas — and then Maryland and Arkansas — reported the first locally acquired cases since 2003.
IV artesunate has been the first-line treatment for severe malaria in the U.S. since 2019 and is the only drug available in the U.S. to treat severe malaria. A study published in 2021 in Clinical Infectious Diseases found that it was safe and effective in treating severe malaria in U.S. adults.
‘Very exciting’ mAbs
Another approach that could help curb malaria is the use of monoclonal antibodies.
Although no mAbs are currently approved for malaria, data published in The New England Journal of Medicine and presented at a medical conference last year demonstrated that one dose of an mAb called CIS43LS safely protected healthy adults from malaria infection during the 6-month malaria season in Mali.
The trial — which was conducted in two parts — evaluated the safety and efficacy of a one-time IV infusion of CIS43LS given to 369 healthy, nonpregnant adults aged 18 to 55 years. The first part of the trial assessed the safety of three different doses — 5 mg, 10 mg and 40 mg per kg of body weight — in six participants per dose level, and the second assessed the efficacy of two different doses compared with a placebo.
In all, 300 participants were randomly assigned in a 1:1:1 ratio to receive either the 10 mg/kg or 40 mg/kg dose or a placebo by IV infusion. The researchers followed participants for 24 weeks, testing their blood for P. falciparum weekly for the first 28 days and then every 2 weeks after that.
Over the 24-week study period, testing detected P. falciparum infections in 35.5% of participants who received a 10 mg/kg dose, 18.2% who received a 40 mg/kg dose and 78.2% who received placebo. The researchers calculated the efficacy of a 40 mg/kg dose of CIS43LS at 6 months to be 88.2% (adjusted 95% CI, 79.3%-93.3%) and the efficacy of a 10 mg/kg dose to be 75% (adjusted 95% CI, 61%-84%) compared with placebo.
The NIH said researchers are testing a second, more potent antimalarial mAb that is given subcutaneously in smaller doses and has shown promise in adults in early-stage testing. It is being assessed in two phase 2 trials in infants, children and adults in Mali and Kenya.
“It will be some time before we learn whether this approach will make sense, but monoclonal antibodies are really another vaccine,” Rosenthal said. “It’s another immunologic approach to controlling malaria and the initial results are very exciting.”
‘Beginning of another journey’
According to Sosler, all these advancements against malaria are not the end of the road.
“We see this as the beginning of another journey,” he said. “Now that we have the first generation of malaria vaccines, what’s next? How can we improve efficacy and have a simpler dose regimen? How can we further diversify manufacturing, particularly in Africa?”
Regardless of what questions are left to answer, Sosler emphasized the importance of having the two vaccines.
Campbell Neurosciences validated a saliva-based test to predict suicidal ideation.
Previous serum biomarker data was used to create the test.
It is the first biology-based test to predict suicidal thoughts.
A saliva-based test from Therapeutic Solutions International’s spin-off company Campbell Neurosciences successfully predicted suicidal ideation, according to a press release.
The test is “the first biological-based system to help predict individuals at risk of this modern-day epidemic,” Kalina O’Connor, president and CEO of Campbell Neurosciences, said in the release.
Campbell Neurosciences successfully validated a saliva-based test for suicidal ideation.
The test was developed using data from a previous clinical trial using blood biomarkers. Specifically, the trial evaluated cytokine levels in 10 people with no history of suicide, 10 people with suicidal ideation and 10 people with suicidal ideation who attempted to take their own life. According to the release, cytokine levels were positively associated with suicidal ideation and behavior.
“The prospects of a simple saliva-based test will allow for a more personalized approach to regenerative psychiatry, which in the end will result in more lives saved,” Timothy Dixon, president and CEO of Therapeutic Solutions International, said in the release.
This overview provides physicians with information about prenatal radiation exposure as an aid in counseling pregnant women.
How to use this document This information is for clinicians. If you are a patient, we strongly advise that you consult with your physician to interpret the information provided, as it may not apply to you. Information on radiation exposure during pregnancy for members of the public can be found on the Health Information for Specific Groups webpage.
CDC recognizes that providing information and advice about radiation to expectant mothers falls into the broader context of preventive healthcare counseling during prenatal care. In this setting, the purpose of the communication is always to promote health and long-term quality of life for the mother and child.
Most of the ways a pregnant woman may be exposed to radiation, such as from a diagnostic medical exam or an occupational exposure within regulatory limits, are not likely to cause health effects for a fetus. However, accidental or intentional exposure above regulatory limits may be cause for concern.
Although radiation doses to a fetus tend to be lower than the dose to the mother, due to protection from the uterus and surrounding tissues, the human embryo and fetus are sensitive to ionizing radiation at doses greater than 0.1 gray (Gy). Depending on the stage of fetal development, the health consequences of exposure at doses greater than 0.5 Gy can be severe, even if such a dose is too low to cause an immediate effect for the mother. The health consequences can include growth restriction, malformations, impaired brain function, and cancer.
Estimating the Radiation Dose to the Embryo or Fetus
Health effects to a fetus from radiation exposure depend largely on the radiation dose. Estimating the radiation dose to the fetus requires consideration of all sources external and internal to the mother’s body, including the following:
Dose from an external source of radiation to the mother’s abdomen.
Dose from inhaling or ingesting a radioactive substance that enters the bloodstream and that may through the placenta.
Dose from radioactive substances that may concentrate in maternal tissues surrounding the uterus, such as the bladder, and that could irradiate the fetus.
Most radioactive substances that reach the mother’s blood can be detected in the fetus’ blood. The concentration of the substance depends on its specific properties and the stage of fetal development. A few substances needed for fetal growth and development (such as iodine) can concentrate more in the fetus than in corresponding maternal tissue.
Consideration of the dose to specific fetal organs is important for substances that can localize in specific organs and tissues in the fetus, such as iodine-131 or iodine-123 in the thyroid, iron-59 in the liver, gallium-67 in the spleen, and strontium-90 and yttrium-90 in the skeleton.
Radiation experts can assist in estimating the radiation dose to the embryo or fetus
Hospital medical physicists and health physicists are good resources for expertise in estimating the radiation dose to the fetus. In addition to the hospital or clinic’s specialized staff, physicians may access resources from or contact the following organizations for assistance in estimating fetal radiation dose.
Once the fetal radiation dose is estimated, potential health effects can be assessed.
Potential Health Effects of Prenatal Radiation Exposure (Other Than Cancer)
Table 1 summarizes the potential non-cancer health risks of concern. This table is intended to help physicians advise pregnant women who may have been exposed to radiation, not as a definitive recommendation. The indicated doses and times post-conception are approximations.
Acute Radiation Dose* to the Embryo/Fetus
Time Post Conception (up to 2 weeks)
Time Post Conception (3rd to 5th weeks)
Time Post Conception (6th to 13th weeks)
Time Post Conception (14th to 23rd weeks)
Time Post Conception (24th week to term)
<0.10 Gy (10 rads)
Noncancer health effects NOT detectable
0.10–0.50 Gy (10–50 rads)
Failure to implant may increase slightly, but surviving embryos will probably have no significant (non-cancer) health effects.
Growth restriction possible
Growth restriction possible
Noncancer health effects unlikely
> 0.50 Gy (50 rads) The expectant mother may be experiencing acute radiation syndrome in this range, depending on her whole-body dose.
Failure to implant will likely be high, depending on dose, but surviving embryos will probably have no significant (non- cancer) health effects.
Probability of miscarriage may increase, depending on dose. Probability of major malformations, such as neurological and motor deficiencies, increases. Growth restriction is likely
Probability of miscarriage may increase, depending on dose. Growth restriction is likely.
Probability of miscarriage may increase, depending on dose. Growth restriction is possible, depending on dose. (Less likely than during the 6th to 13th weeks post conception) Probability of major malformations may increase
Miscarriage and neonatal death may occur, depending on dose. §
8th to 25th Weeks Post Conception: The most vulnerable period for intellectual disability is 8th to 15th weeks post conception Severe intellectual disability is possible during this period at doses > 0.5 Gy Prevalence of intellectual disability (IQ<70) is 40% after an exposure of 1 Gy from 8th to 15th week Prevalence of intellectual disability (IQ<70) is 15% after an exposure of 1 Gy from 16th to 25th week Note: This table is intended only as a guide. The indicated doses and times post conception are approximations. Table adapted from Table 1.1. of the National Council on Radiation Protection and Measurements’ Report No. 174, “Preconception and Prenatal Radiation Exposure: Health Effects and Protective Guidance” [NCRP2013]. * Acute dose: dose delivered in a short time (usually minutes). Fractionated or chronic doses: doses delivered over time. For fractionated or chronic doses, the health effects to the fetus may differ from what is depicted here. † Both the gray (Gy) and the rad are units of absorbed dose and reflect the amount of energy deposited into a mass of tissue (1 Gy = 100 rads). In this document, the absorbed dose is that dose received by the entire fetus (whole-body fetal dose). The referenced absorbed dose levels in this document are assumed to be from beta, gamma, or x-radiation. § For adults, the LD50/60 (the dose necessary to kill 50% of the exposed population in 60 days) is about 3-5 Gy (300-500 rads) and the LD100 (the dose necessary to kill 100% of the exposed population) is around 10 Gy (1000 rads). Table adapted from Table 1.1. of the National Council on Radiation Protection and Measurements’ Report No. 174, “Preconception and Prenatal Radiation Exposure: Health Effects and Protective Guidance” [NCRP2013].
Gestational age and radiation dose are important determinants of potential non-cancer health effects. The following points are of particular note.
During the first 2 weeks post-conception, the health effect of concern from an exposure of ≥ 0.1 Gy is the possibility of death of the embryo. Because the embryo is made up of only a few cells, damage to one cell, the progenitor of many other cells, may cause the death of the embryo, and the blastocyst may fail to implant in the uterus. Embryos that survive, however, are unlikely to exhibit congenital abnormalities or other non-cancer health effects, no matter what dose of radiation they received.
In all stages post-conception, radiation-induced non-cancer health effects are not detectable for fetal doses below about 0.10 Gy.
Carcinogenic Effects of Prenatal Radiation Exposure
Radiation exposure to an embryo/fetus may increase the risk of cancer in the offspring, especially at radiation doses > 0.1 Gy, which are well above typical doses received in diagnostic radiology. However, attempting to quantify cancer risks from prenatal radiation exposure presents many challenges. These challenges include the following:
The primary data for the risk of developing cancer from prenatal exposure to radiation come from the lifespan study of the Japanese atomic bomb (A-bomb) survivors. [Preston et al. 2008]. The analysis of that cohort includes cancer incidence data only up to the age of 50 years. This precludes making lifespan risk estimates as a result of prenatal radiation exposure.
From the Japanese lifespan study [Preston et al. 2008], it can be concluded that for those exposed in early childhood (birth to age 5 years), the theoretical risk of an adult-onset cancer by age 50 is approximately ten-fold greater than the risk for those who received prenatal exposure. Therefore, the risk following prenatal exposure may be considerably lower than for radiation exposure in early childhood [NCRP2013].
No reliable epidemiological data are available from studies to determine which stage of pregnancy is the most sensitive for radiation-induced cancer in the offspring [NCRP2013].
The lifespan study of the Japanese A-bomb survivors is continuing as the cohort ages. Future analyses of the accumulating data should provide a better understanding of the lifetime risk of cancer from prenatal and early childhood radiation exposure.
Radioactive contamination and radiation exposure could occur if radioactive materials are released into the environment as the result of an accident, an event in nature, or an act of terrorism. Such a release could expose people and contaminate their surroundings and personal property.
Internal contamination occurs when people swallow or breathe in radioactive materials, or when radioactive materials enter the body through an open wound or are absorbed through the skin. Some types of radioactive materials stay in the body and are deposited in different body organs. Other types are eliminated from the body in blood, sweat, urine, and feces.
Radioactive Contamination
Radioactive contamination occurs when radioactive material is deposited on or in an object or a person. Radioactive materials released into the environment can cause air, water, surfaces, soil, plants, buildings, people, or animals to become contaminated. A contaminated person has radioactive materials on or inside their body.
How Radioactive Contamination Is Spread
People who are externally contaminated with radioactive material can contaminate other people or surfaces that they touch. For example, people who have radioactive dust on their clothing may spread the radioactive dust when they sit in chairs or hug other people.
People who are internally contaminated can expose people near them to radiation from the radioactive material inside their bodies. The body fluids (blood, sweat, urine) of an internally contaminated person can contain radioactive materials. Coming in contact with these body fluids can result in contamination and/or exposure.
External Contamination
External contamination occurs when radioactive material, in the form of dust, powder, or liquid, comes into contact with a person’s skin, hair, or clothing. In other words, the contact is external to a person’s body. People who are externally contaminated can become internally contaminated if radioactive material gets into their bodies.
Radiation Exposure
Radioactive materials give off a form of energy that travels in waves or particles. This energy is called radiation. When a person is exposed to radiation, the energy penetrates the body. For example, when a person has an x-ray, he or she is exposed to radiation.
How Your Home Could Become Contaminated
People who are externally contaminated can spread the contamination by touching surfaces, sitting in a chair, or even walking through a house. Contaminants can easily fall from clothing and contaminate other surfaces.
Homes can also become contaminated with radioactive materials in body fluids from internally contaminated people. Making sure that others do not come in contact with body fluids from a contaminated person will help prevent contamination of other people in the household.
How You Can Limit Contamination
Since radiation cannot be seen, smelled, felt, or tasted, people at the site of an incident will not know whether radioactive materials were involved. You can take the following steps to limit your contamination.
Get out of the immediate area quickly. Go inside the nearest safe building or to an area to which you are directed by law enforcement or health officials.
Remove the outer layer of your clothing. If radioactive material is on your clothes, getting it away from you will reduce the external contamination and decrease the risk of internal contamination. It will also reduce the length of time that you are exposed to radiation.
If possible, place the clothing in a plastic bag or leave it in an out-of-the-way area, such as the corner of a room. Keep people away from it to reduce their exposure to radiation. Keep cuts and abrasions covered when handling contaminated items to avoid getting radioactive material in them.
Wash all of the exposed parts of your body using lots of soap and lukewarm water to remove contamination. This process is called decontamination. Try to avoid spreading contamination to parts of the body that may not be contaminated, such as areas that were clothed.
After authorities determine that internal contamination may have occurred, you may be able to take medication to reduce the radioactive material in your body.
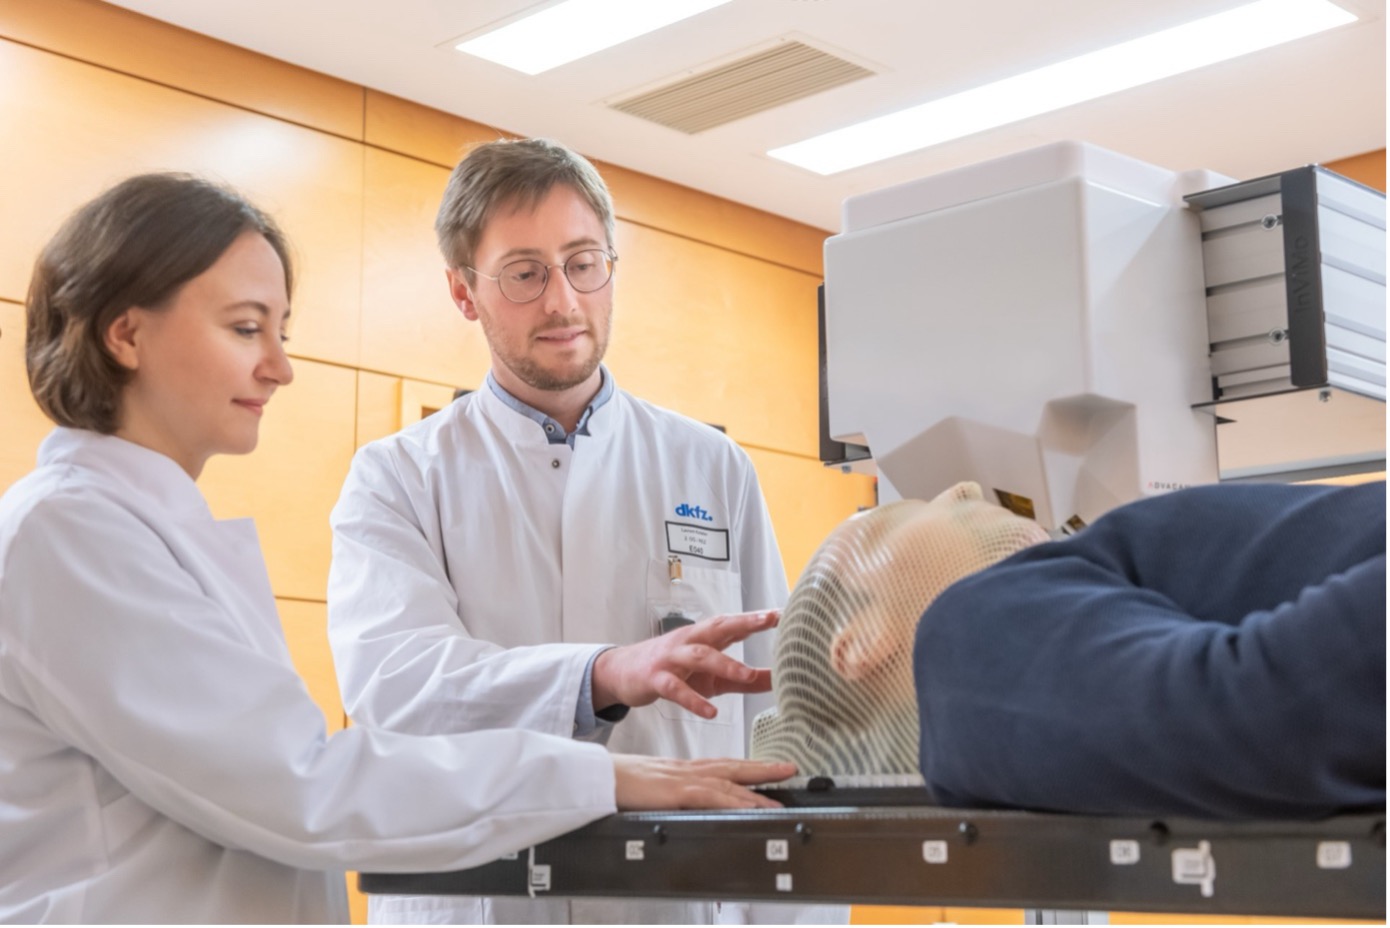


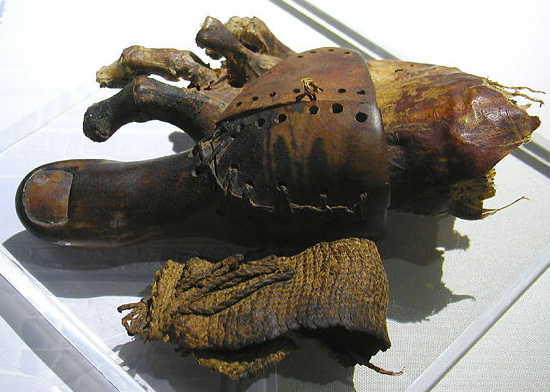


