Has cancer overtaken CVD as a leading cause of death in people with T2D?
Older people with type 2 diabetes faced a higher burden of cancer mortality in recent years, according to a U.K. study.
In a cohort of over 137,000 individuals with type 2 diabetes, all-cause mortality rates dropped among all age groups from 1998-2018, reported Suping Ling, PhD, of the University of Leicester in England, and colleagues.
However, this was juxtaposed by an increase in cancer-related morality rates for people ages 75 and 85 with type 2 diabetes, they wrote in Diabetologiaopens in a new tab or window.
During the median follow-up of 8.4 years, those ages 75 with diabetes saw a 1.2% average annual percentage change (AAPC) in cancer mortality rate, while those ages 85 saw a 1.6% bump each year. On the other hand, those ages 55 and 65 saw a respective 1.4% and 0.2% annual drop in cancer mortality.
Ling’s group examined who was most impacted by this rising cancer mortality rate, and reported that people with morbid obesity (BMI 35-plus) saw one of the highest annual increases of 5.8%. Comparatively, those with a normal body weight (BMI 18.5-24.9) with type 2 diabetes only saw an average 0.7% increase.
Additionally, there was a 1.5% AAPC in cancer mortality for women versus a 0.5% increase for men. The authors noted that “[a]ll-cancer mortality rates and proportions of cancer deaths were higher in men than women for most of the 1998-2018 period, with the gap in both rates and proportions being smaller around 2012-2014 and widening since 2014.”
There also appeared to be an increasing trend in cancer mortality rates for former or current smokers (0.6% and 3.4%, respectively), as well as white individuals (2.4%), whereas downward trends were seen for nonsmokers (-1.4%) and other ethnic groups (-3.4%).
And those living in the least deprived areas saw a 1.5% AAPC compared with a 1% increase for those living in the most deprived areas.
Certain cancer-specific mortality trends emerged among this population with diabetes. Compared with the general population, there were significantly higher standardized mortality ratios (SMRs) for several cancer types among people with type 2 diabetes from 1998-2018:
Colorectal: SMR 2.40 (95% CI 2.26-2.54)
Pancreatic: SMR 2.12 (95% CI 1.99-2.25)
Liver: SMR 2.13 (95% CI 1.94-2.33)
Endometrial: SMR 2.08 (95% CI 1.76-2.44)
Lung: SMR 1.04 (95% CI 1.00-1.08)
Breast in women: SMR 1.09 (95% CI 1.01-1.18)
“The prevention of cardiovascular disease has been, and is still considered, a priority in people with diabetes. Our results challenge this view by showing that cancer may have overtaken cardiovascular disease as a leading cause of death in people with type 2 diabetes,” stated Ling’s group.
“Cancer prevention strategies therefore deserve at least a similar level of attention as cardiovascular disease prevention, especially for colorectal, pancreatic, liver and endometrial cancer, whose mortality rates were substantially higher in individuals with type 2 diabetes than in the general population,” they added.
“Persistent inequalities in cancer mortality rates by sociodemographic factors and widening disparities by smoking status suggest that tailored cancer prevention and detection strategies are needed,” they said. “For example, some subgroups such as smokers experienced not only higher mortality rates but also increasing mortality trends during the study period.”
For the population-based study, the researchers drew upon data on 137,804 newly diagnosed adults, ages 35 and older, with type 2 diabetes in the Clinical Practice Research Datalink. Those with type 1 diabetes were excluded.
The average BMI was 30.6, 55% were men, and 83% were white. Nearly half were nonsmokers and about a third were ex-smokers.
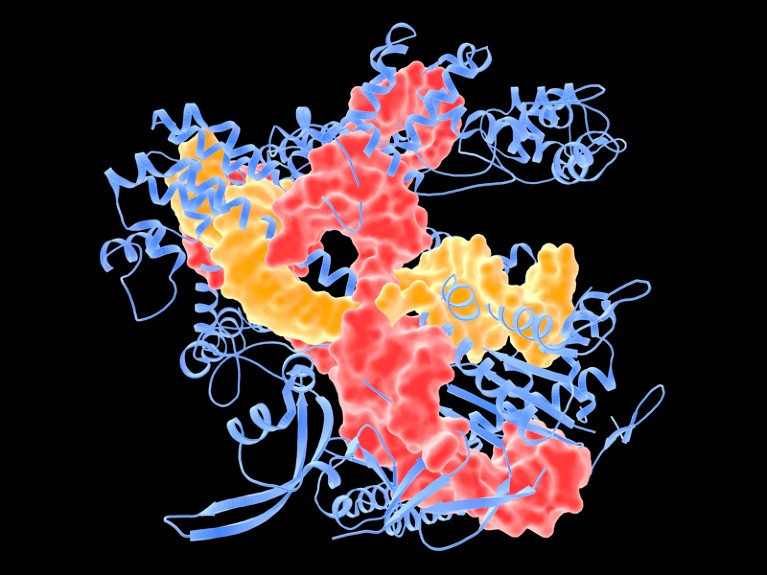
The CRISPR–Cas9 complex (blue and yellow) can precisely cut DNA (red)
A small clinical trial has shown that researchers can use CRISPR gene editing to alter immune cells so that they will recognize mutated proteins specific to a person’s tumours. Those cells can then be safely set loose in the body to find and destroy their target.
It is the first attempt to combine two hot areas in cancer research: gene editing to create personalized treatments, and engineering immune cells called T cells so as to better target tumours. The approach was tested in 16 people with solid tumours, including in the breast and colon.Landmark CRISPR trial shows promise against deadly disease
“It is probably the most complicated therapy ever attempted in the clinic,” says study co-author Antoni Ribas, a cancer researcher and physician at the University of California, Los Angeles. “We’re trying to make an army out of a patient’s own T cells.”
The results were published in Nature1 and presented at the Society for Immunotherapy of Cancer meeting in Boston, Massachusetts on 10 November.
Tailored treatments
Ribas and his colleagues began by sequencing DNA from blood samples and tumour biopsies, to look for mutations that are found in the tumour but not in the blood. This had to be done for each person in the trial. “The mutations are different in every cancer,” says Ribas. “And although there are some shared mutations, they are the minority.”
The researchers then used algorithms to predict which of the mutations were likely to be capable of provoking a response from T cells, a type of white blood cell that patrols the body looking for errant cells. “If [T cells] see something that looks not normal, they kill it,” says Stephanie Mandl, chief scientific officer at PACT Pharma in South San Francisco, California, and a lead author on the study. “But in the patients we see in the clinic with cancer, at some point the immune system kind of lost the battle and the tumour grew.”
After a series of analyses to confirm their findings, validate their predictions and design proteins called T-cell receptors that are capable of recognizing the tumour mutations, the researchers took blood samples from each participant and used CRISPR genome editing to insert the genes encoding these receptors into their T cells. Each participant then had to take medication to reduce the number of immune cells they produced, and the engineered cells were infused.CRISPR ‘cousin’ put to the test in landmark heart-disease trial
“This is a tremendously complicated manufacturing process,” says Joseph Fraietta, who designs T-cell cancer therapies at the University of Pennsylvania in Philadelphia. In some cases, the entire procedure took more than one year.
Each of the 16 participants received engineered T cells with up to three different targets. Afterwards, the edited cells were found circulating in their blood, and were present in higher concentrations near tumours than non-edited cells had been prior to the treatment. One month after treatment, five of the participants experienced stable disease, meaning that their tumours had not grown. Only two people experienced side effects that were probably due to the activity of the edited T cells.
Although the efficacy of the treatment was low, the researchers used relatively small doses of T cells to establish the safety of the approach, says Ribas. “We just need to hit it stronger the next time,” he says.
And as researchers develop ways to speed up the therapies’ development, the engineered cells will spend less time being cultured outside of the body and could be more active when they are infused. “The technology will get better and better,” says Fraietta.
A solid start
Engineered T cells — called CAR T cells — have been approved for the treatment of some blood and lymph cancers, but solid tumours have posed a particular challenge. CAR T cells are effective only against proteins that are expressed on the surface of tumour cells. Such proteins can be found across many blood and lymph cancers, which means there is no need to design new T-cell receptors for each person with cancer.CRISPR treatment inserted directly into the body for first time
But common surface proteins have not been found in solid tumours, says Fraietta. And solid tumours provide physical barriers to T cells, which must circulate through the blood, travel to the tumour and then infiltrate it to kill the cancer cells. Tumour cells also sometimes suppress immune responses, both by releasing immune-suppressing chemical signals and by using up the local supply of nutrients to fuel their rapid growth.
“The environment around a tumour is like a sewer,” says Fraietta. “T cells are rendered less functional as soon as they hit the site.”
With this initial proof of concept in hand, Mandl and her colleagues hope to be able to engineer T cells not only to recognize cancer mutations, but also to be more active near the tumour. Mandl says there are several potential ways to toughen up T cells, for example by removing the receptors that respond to immunosuppressive signals, or by tweaking their metabolism so that they can more easily find an energy source in the tumour environment.
Such elaborate designs could be feasible thanks to recent technological advances in using CRISPR to edit T cells, says Avery Posey, who studies cell and gene therapies for cancer at the University of Pennsylvania. “It’s become incredibly efficient,” he says. “We’ll see very sophisticated means of engineering immune cells within the next decade.”
With a slew of tools to trick out immune cells, researchers are expanding the repertoire of CAR-T therapies.
Crystal Mackall remembers her scepticism the first time she heard a talk about a way to engineer T cells to recognize and kill cancer. Sitting in the audience at a 1996 meeting in Germany, the paediatric oncologist turned to the person next to her and said: “No way. That’s too crazy.”
Today, things are different. “I’ve been humbled,” says Mackall, who now works at Stanford University in California developing such cells to treat brain tumours. The US Food and Drug Administration approved the first modified T cells, called chimeric antigen receptor (CAR)-T cells, to treat a form of leukaemia in 2017. The treatments have become game changers for several cancers. Five similar products have been approved, and more than 20,000 people have received them. A field once driven by a handful of dogged researchers now boasts hundreds of laboratory groups in academia and industry. More than 500 clinical trials are under way, and other approaches are gearing up to jump from lab to clinic as researchers race to refine T-cell designs and extend their capabilities. “This field is going to go way beyond cancer in the years to come,” Mackall predicts.CRISPR cancer trial success paves the way for personalized treatments
Advances in genome editing through processes such as CRISPR, and the ability to rewire cells through synthetic biology, have led to increasingly elaborate approaches for modifying and supercharging T cells for therapy. Such techniques are providing tools to counter some of the limitations of current CAR-T therapies, which are expensive to make, can have dangerous side effects, and have so far been successful only against blood cancers. “These techniques have expanded what we’re able to do with CAR strategies,” says Avery Posey, a cancer immunology researcher at the University of Pennsylvania in Philadelphia. “It will really take this type of technology forward.”
Even so, the challenge of making such a ‘living drug’ from a person’s cells extends beyond complicated designs. Safety and manufacturing problems remain to be addressed for many of the newest candidates. “There’s an explosion of very fancy things, and I think that’s great,” says immunologist Michel Sadelain at the Memorial Sloan Kettering Cancer Center in New York City. “But the complexity cannot always be brought as described into a clinical setting.”
Revved up and ready to go
CAR-T therapies capitalize on the activities of T cells, the immune system’s natural hunters that prowl through the body looking for things that don’t belong. Foreign cells, or those infected with a virus, express unusual proteins that serve as a beacon to T cells, some of which release a toxic stew of molecules to destroy the abnormal cells. This search-and-destroy function can also target cancer cells for elimination, but tumours often have ways of disarming the immune system, such as by cloaking abnormal proteins or suppressing T-cell function.
CAR-T cells carry synthetic proteins — the chimeric antigen receptors — that span the cell membrane. On the outside is a structure that functions like an antibody, binding to specific molecules on the surface of some cancer cells. Once that has bound, the portion of the protein inside the cell stimulates T-cell activity, hot-wiring it into action. The result is a tiny, revved-up, cancer-fighting machine.
Approved CAR-T therapies target one of two proteins found on immune cells called B cells, and are used to treat certain forms of leukaemia and lymphoma that involve the unchecked proliferation of these cells. The proteins — CD19 and BCMA — are not unique to cancer, meaning that the therapies kill B cells indiscriminately. However, people can live without these cells.
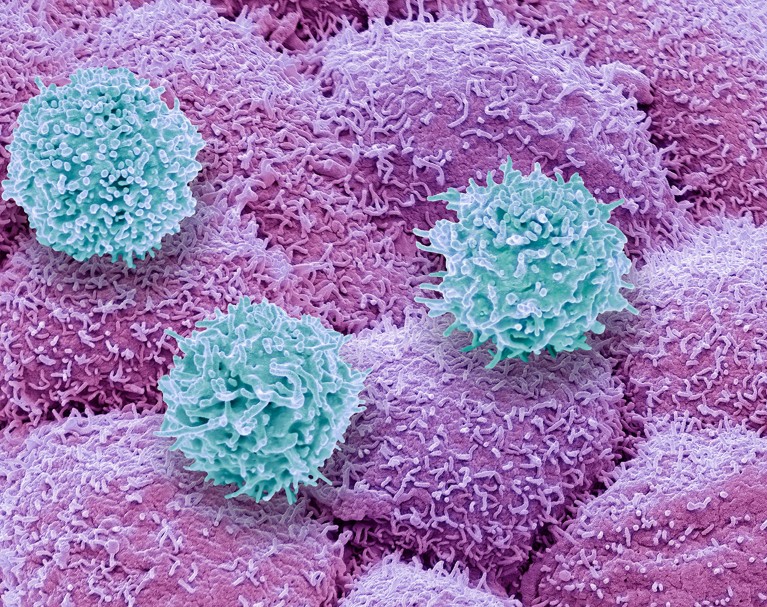
T cells (blue) of the immune system attacking prostate cancer cells (pink).Credit: Steve Gschmeissner/SPL
There is still plenty of room for improvement in CAR-T therapies. Although the effects can be long-lasting — sometimes even curative — cancer eventually returns in most people who have been treated. Solid tumours, such as those found in lung or pancreatic cancers, have so far not responded convincingly to CAR-T cells. The therapy has safety risks and can, in rare instances, be fatal. And it must be custom-made for each recipient, using their own T cells as a starting point, resulting in a relatively slow and expensive manufacturing process.
As yet, there are no simple solutions to any of these problems. “We clearly have a long way to go,” says Mackall. “But we’re now seeing promising signals.”
Some progress is being made against solid tumours. These often contain a heterogeneous mosaic of cells that have different combinations of mutations. This means that a CAR-T therapy directed at a particular mutated protein might work for only one subset of cells. The tight mass of a solid tumour can also be difficult for T cells to penetrate, and researchers have struggled to find suitable targets that won’t wreak havoc in healthy tissues.
Despite this, some clinical trials have shown glimmers of efficacy. Mackall and her colleagues have engineered CAR-T cells to target a molecule called GD2, which is expressed at high levels by some brain and spinal-cord cancers called gliomas. The team gave one intravenous dose of CAR-T therapy to people with gliomas, then administered multiple, lower doses directly into the brain. She and her colleagues reported last year that three of four people treated in this way responded positively1. “These cells just dive right into the brain,” says Mackall. “And the body doesn’t reject them up there — it’s playing in that immune-privileged space.”
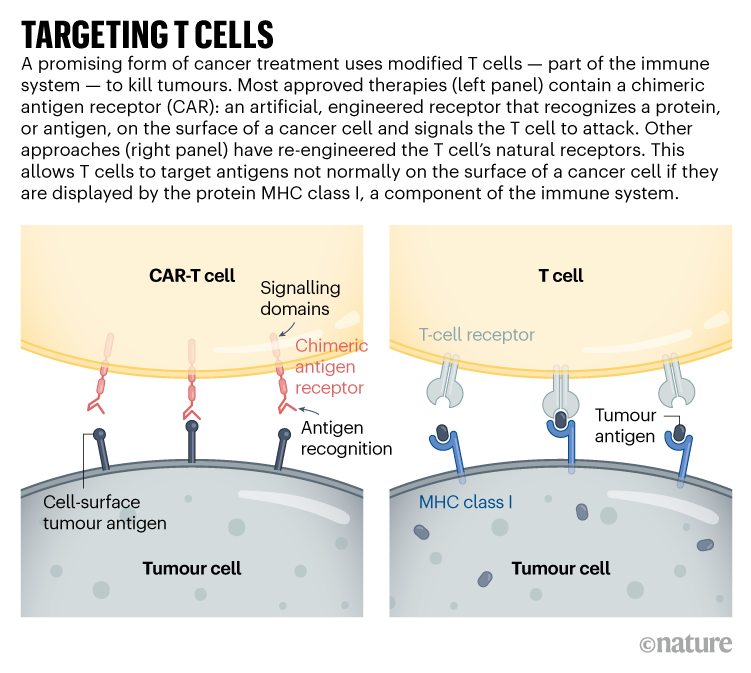
Targeting solid tumours could require T-cell therapies that recognize more than one mutated protein or that can target cancer cells expressing higher levels of a given protein than normal cells do. One clinical trial that reported results in November 2022 took this to the extreme: rather than using CARs, the team used CRISPR to engineer natural T-cell receptors (see ‘Targeting T cells’) to recognize mutated proteins found in each participant’s tumour2. The individuals received a mixture of cells targeting different proteins, in the hope that solid tumours would be less likely to develop resistance to a therapy with multiple targets. Tumours stopped growing in 5 of the 16 participants 28 days after treatment. Researchers hope to tweak the protocol, including giving higher doses, to boost effectiveness.
The ability to track and fine-tune T-cell activity is also improving, says immunologist Carl June at the University of Pennsylvania. Through advanced single-cell analyses, researchers can follow the fate of both the engineered cells and the tumours they are designed to kill. They can determine which T cells have become ‘exhausted’ — a dysfunctional state that can come from prolonged stimulation — and which tumour cells are becoming resistant to treatment. They can also see whether the environment surrounding a CAR-T-treated tumour has become riddled with immune-suppressing cells (such as macrophages or regulatory T cells). Overcoming that local immune suppression will be key to harnessing T cells to fight solid tumours, says Yangbing Zhao, chief scientific officer at UTC Therapeutics, a biotechnology company headquartered in Singapore that is developing CAR-T therapies. “No matter how many targets you target, if the tumour is evading the immune response, it won’t work,” he says.
June and his colleagues used a single-cell approach to study resistance to CAR-T therapies that target CD19, and found that CAR-T products that were less able to activate certain helper T cells were associated with the emergence of resistance3. They also used single-cell techniques to learn more about why CAR-T cells directed against a protein called mesothelin, found in pancreatic cancer cells, often fail. Reducing the activity of two genes in CAR-T cells might bolster the therapy4. “We’re going to be able to understand these resistance mechanisms,” says June. “And then with all of these tools like CRISPR, we’re going to engineer around them.”
In addition to editing T cells, CRISPR has been used to find more ways of modifying them. Immunologist Alexander Marson at the Gladstone Institutes in San Francisco, California, and his colleagues used CRISPR to activate or suppress thousands of genes in T cells, and then looked at the effect the changes had on the production of crucial immune-regulating proteins called cytokines5. In another screen using CRISPR, the team found that reducing the activity of a protein called RASA2 enhanced the ability of CAR-T cells to kill their targets6. “We’re learning lessons about the genes that we can turn up and turn down to tune T cells to behave as we want,” says Marson.
Synthetic biologists have also set their sights on T cells, and are engineering sophisticated cellular circuits that could allow greater control over the expression of CARs and other proteins that might increase T-cell activity. In December last year, synthetic biologist Wendell Lim at the University of California, San Francisco, and his colleagues reported7 that they had engineered T cells to express both a CAR and IL-2, an immune-regulating protein. IL-2 can improve T-cell penetration into solid tumours and overcome the immunosuppressive signals that tumours release, but it can be toxic when administered systemically. Letting the T cells produce IL-2 enables local administration of the protein, which could bypass its toxicity to other tissues.Last-resort cancer therapy holds back disease for more than a decade
Other synthetic circuits have been designed to allow precise regulation of CAR expression, by placing it under the control of genetic elements that activate the necessary genes in response to a drug8. So far, however, most of these complicated designs have not yet gone through the safety studies and standardization required for use in people, says Sadelain.
Researchers are learning so many lessons that a big question for the field is now determining which engineered T cells to take forwards into human studies, says oncologist Marcela Maus at Massachusetts General Hospital in Boston. “We can invent and innovate so much in the lab, but there is this funnel of translating that into clinical trials,” she says. “There’s so many things we can do. We have to figure out which are the best things to tweak and test in trials.”
Costly business
Manufacturing CAR-T cells is already wildly complex by pharmaceutical standards. So far, all approved therapies require engineering a person’s own T cells to express the CAR. That adds to the time and thus the cost of producing the therapies: in the United States, a single treatment with CAR-T cells can be about US$500,000, not including the cost of hospitalization and associated treatments.
Creating CAR-T cells that can be given to multiple people — often called off-the-shelf cells — has long been viewed as crucial to lowering the price of the therapy. But early results suggest that there is still work to do, says bioengineer Rahul Purwar at the Indian Institute of Technology Bombay. Although the cells can be edited to reduce the chance that they will themselves be eliminated by the immune system, early trials suggest that they do not survive long after infusion and might still be rejected (see, for example, ref. 9)9. “Off-the-shelf is a great approach,” he says. “It is coming, but right now we are not yet there.”Cancer treatments boosted by immune-cell hacking
The therapy is also rarely available outside wealthy countries. In Brazil, haematologist Renato Luiz Guerino Cunha at Oncoclínicas Group in São Paulo was the first in the country to treat someone with CAR-T therapy in 2019. But progress has been slow, he says: he lacks the capacity to rapidly produce large quantities of cells. “In three years, we treated just six patients,” he says. “We need new technology for the processing.”
Producing a CAR-T cell therapy typically involves using a type of virus called a lentivirus as a vector to shuttle in the synthetic CAR gene. But more research into gene therapies has increased demand for clinical-grade lentiviruses. Researchers now wait months and pay top dollar to complete their experiments; Cunha produces his own but can do so only in tiny quantities. Improvements to CRISPR gene editing could help in this regard.
Despite the challenges, CAR-T therapies continue to expand, with some of the hundreds of clinical trials worldwide exploring entirely new applications. Last year, researchers reported promising results in a small trial of CAR-T therapies to treat a form of the autoimmune disease lupus10. And in a study in mice, researchers reprogrammed T cells without the usual first step of removing them from the body, creating CAR-T cells designed to clear scar tissue from the heart11.
In December, June and his colleagues unveiled a way to streamline cell production. At the American Society of Hematology’s annual meeting in New Orleans, Louisiana, the team announced12 that reducing manufacturing times and engineering CAR-T cells to express a protein called IL-18 boosted their efficacy and allowed researchers to reduce the dose of cells given to people. “Those patients had incredible responses,” says Maus of the clinical trial, “which gives you this really tantalizing hint that if you engineer the T cell better, you can make it even more powerful.”
Satellite navigation systems for lunar settlements will require local atomic clocks. Scientists are working out what time they will keep.
Scientists and space agencies have not yet agreed how to define lunar time.Credit: NASA Goddard
The coming decade will see a resurgence in lunar exploration — including dozens of missions and plans to establish permanent bases on the Moon. The endeavours pose myriad challenges. Among them is a subtle, but fundamental, question that metrologists worldwide are working to answer: what time is it on the Moon?
“We’re just starting to lay this out,” says Cheryl Gramling, an aerospace engineer who leads the position, navigation and timing team at NASA’s Goddard Space Flight Center in Greenbelt, Maryland.The $93-billion plan to put astronauts back on the Moon
The Moon doesn’t currently have an independent time. Each lunar mission uses its own timescale that is linked, through its handlers on Earth, to coordinated universal time, or utc — the standard against which the planet’s clocks are set. But this method is relatively imprecise and spacecraft exploring the Moon don’t synchronize the time with each other. The approach works when the Moon hosts a handful of independent missions, but it will be a problem when there are multiple craft working together. Space agencies will also want to track them using satellite navigation, which relies on precise timing signals.
It’s not obvious what form a universal lunar time would take. Clocks on Earth and the Moon naturally tick at different speeds, because of the differing gravitational fields of the two bodies. Official lunar time could be based on a clock system designed to synchronize with utc, or it could be independent of Earth time.
Representatives of space agencies and academic organizations worldwide met in November 2022 to start drafting recommendations on how to define lunar time at the European Space Research and Technology Centre of the European Space Agency (ESA) in Noordwijk, the Netherlands.
Decisions must be made soon, says Patrizia Tavella, who leads the time department at the International Bureau of Weights and Measures in Sèvres, France. If an official lunar time is not established, space agencies and private companies will come up with their own solutions, she says. “This is why we want to raise an alert now, saying let’s work together to take a common decision.”
Tracking satellites
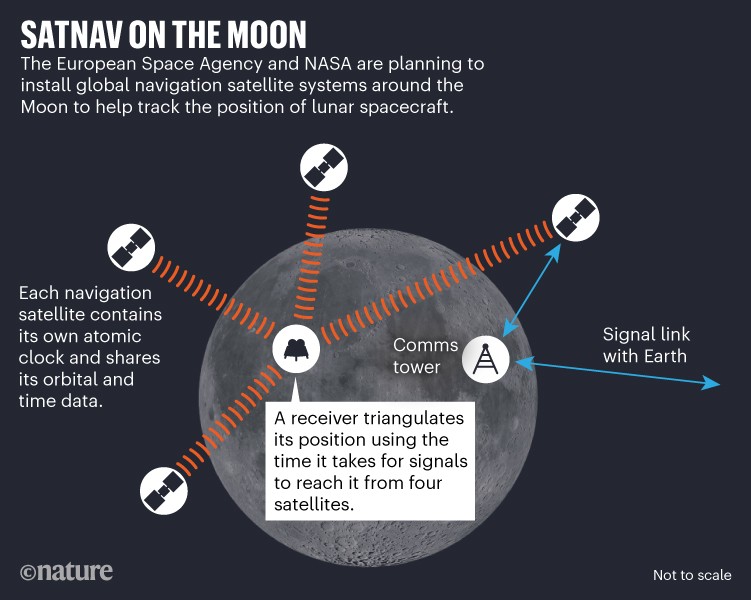
The most pressing need for lunar time comes from plans to create a dedicated global satellite navigation system (GNSS) for the Moon, similar to how GPS and other satellite navigation networks enable precise location tracking on Earth. Space agencies plan to install this lunar GNSS from around 2030. ESA approved a lunar satellite navigation project called Moonlight at its ministerial council meeting on 22 and 23 November 2022 in Paris, and NASA established a similar project, called Lunar Communications Relay and Navigation Systems, last January.
Until now, Moon missions have pinpointed their locations using radio signals sent to large antennas on Earth at scheduled times. But with dozens of missions planned, “there’s just not enough resources to cover everybody”, says Joel Parker, an engineer who works on lunar navigation at the Goddard Center.
Image credit: NASA
As a first step, from 2024, ESA and NASA will trial deriving positions on the Moon using faint satellite navigation signals from Earth-based craft. Next, the lunar GNSS projects plan to place dedicated satellites around the Moon, each containing their own atomic clock (see ‘Satnav on the Moon’). A receiver, for example on the Moon’s surface, will then triangulate its position using the time it takes for satellite signals to reach it. ESA has planned an initial constellation of four spacecraft that would cover navigation at the lunar south pole, which harbours much of the Moon’s water and is an important target for exploration, says Jörg Hahn, an engineer working on ESA’s Moonlight project.
Moon missions will also need an official lunar time to cooperate and communicate, says Hahn. “All this has to trace to one kind of a time reference, otherwise you have chaos and things do not work together.”
Another open question, says Hahn, is whether astronauts would use universal lunar time everywhere on the Moon. Although lunar time would remain the official timescale, its users might, as on Earth, want to offset it in time zones that link to the Sun’s position in the sky. This is less a question for metrologists and more one of convention. “When somebody really lives there on the Moon, I think it makes sense,” he says.
Characterizing time
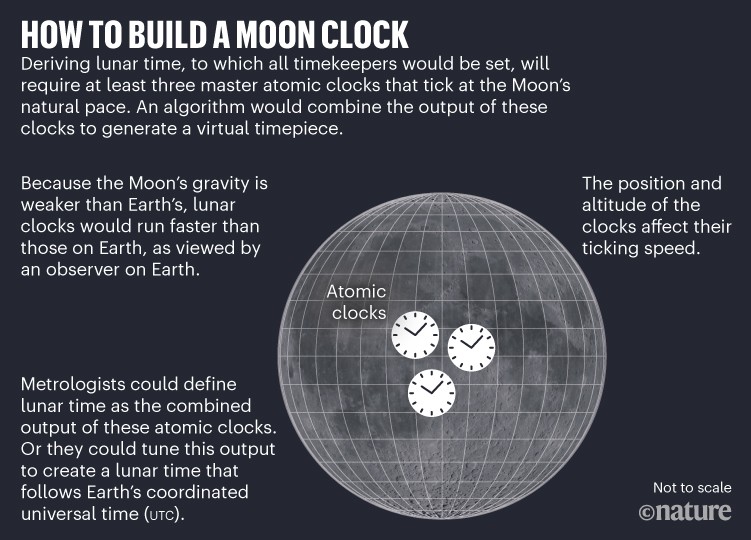
Defining lunar time is not simple. Although the definition of the second is the same everywhere, the special theory of relativity dictates that clocks tick slower in stronger gravitational fields. The Moon’s gravitational pull is weaker than Earth’s, meaning that, to an observer on Earth, a lunar clock would run faster than an Earth one. Gramling estimates that a lunar clock would gain about 56 microseconds over 24 hours. Compared with one on Earth, a clock’s speed would also subtly change depending on its position on the lunar surface, because of the Moon’s rotation, says Tavella. “This is a paradise for experts in relativity, because you have to take into account so many things,” she adds.
Defining a lunar standard, with which all clocks are compared, will involve installing at least three master clocks that tick at the Moon’s natural pace, and whose output is combined by an algorithm to generate a more accurate virtual timepiece (see ‘How to build a Moon clock’).
What happens then depends on which option metrologists choose. They might decide to base lunar time on utc. In that case, this virtual lunar time would be synchronized regularly with terrestrial utc. Between the check-ins, the lunar master clocks would keep marking time until the next synchronization. This has the advantage of being simple for users back on Earth to interact with.
Image credit: NASA
The alternative would be to use the synthesized output of the lunar atomic clocks as the Moon’s own independent, continuous time, and to track its relationship to utc. That way, even if the connection with Earth is lost, clocks on the Moon will still agree with each other and allow safe navigation and communications, says Gramling. Establishing an independent time is a model that will also work for the more-distant planets that space agencies are ultimately targeting, such as Mars. Transmitting utc there would be more complicated than to the Moon, she adds.
In this scenario, days on the Moon could even be defined differently from those on Earth, to account for the time from solar noon to solar noon taking an average of 29.5 Earth days. Earth days will always matter to astronauts, given the human need for sleep on a roughly 24-hour cycle. But the definition is something metrologists will need to agree on.NASA’s Orion spacecraft reaches the Moon — in pictures
Metrologists will also need to decide where on the Moon to place the master clocks. As on Earth, the devices’ altitude will affect ticking speed. The clocks could be in lunar orbit or on the surface, says Hahn. “This is what we are discussing right now with our NASA colleagues.”
Space agencies are also considering other necessary standards — such as which maps of the lunar terrain and coordinate systems to use for navigation — through the Interagency Operations Advisory Group, a council of national space agencies and the United Nations International Committee on GNSS. To make various countries’ systems interoperable, reference systems will have to be agreed internationally, says Gramling.
With ESA’s help, NASA is developing a framework called LunaNet, for which it hopes to get international buy-in. LunaNet consists of a set of rules that would enable all lunar satellite navigation, communication and computing systems to form a single network similar to the Internet, regardless of which nation installs them. Setting lunar time is part of a much bigger picture.
“The idea is to produce a Solar System internet,” says Gramling. “And the first part would be at the Moon.”
You might be a little confused about this question, or you might know exactly what I mean, but allow me to explain anyway.
Lately life has been some sort of a rollercoaster and even though I’ve been reading and listening to a lot of personal development, life, and spiritual books and content, it is still a challenge to be dealing with it all when it hits me. And many times it happens when I am at peace, feeling grateful and experience joy in most aspects of my life.
It’s almost as if I keep being tested. It’s almost as if I need to understand that I still haven’t learned my lessons and there’s much more for me to take in.
It’s almost as if I get too “cocky” in my feel good states and I need to have my feet back on the ground because my balance would be off if I stayed there. Every time it happens I am reminded about what the great Lao Tzu stated so wisely in the Tao Te Ching:
“He who stands on tiptoe doesn’t stand firm. He who rushes ahead doesn’t go far. He who tries to shine dims his own light. He who defines himself can’t know who he really is. He who has power over others can’t empower himself. He who clings to his work will create nothing that endures.
If you want to accord with the Tao, just do your job, then let go.”~ Lao Tzu
When Enough is Enough
There’s nothing wrong with experiencing joy and happiness, bliss and peace, but when experiencing the opposite brings me so much pain, stress, and anxiety, for sure something is not right. Again, not because one shouldn’t experience such beautiful feelings, but because one should experience everything that life brings his way from a place of balance, peace, and discernment. Good or bad, the balance should always be there.
Nothing and no one should have so much power over you that you lose your own peace, balance and inner bliss. You are bigger than any of it, and the moment you realize this, that’s the moment everything changes. Life changes.
It had happened to me so many times to fall in a deep pit of despair and self defeating thoughts, feeling like I will never amount to anything, like my wings were simply cut off and I would have no way to get back up. Yet, every single time I got back up. Every single time I got back up stronger, and wiser.
This year was a challenging one for me and I just feel like I’m still shaking have some leftovers to shake off but I am getting there and that’s because I started saying enough is enough!
How did this happen?
Well…
For me ENOUGH was enough when I felt like I couldn’t fall any lower and I decided that was it. I had to pick myself up, dust myself off and LIVE again. Not that I had ever stopped, but living in the real sense of the word. Living in Love, Joy, Peace and Freedom.
For me ENOUGH was enough when I felt like there needs to be more to life than the struggles, the lacking, the emptiness and the need to fill that eternal void from my Soul with things of the world.
Looking back a few months, for me ENOUGH was enough when I was sitting on the bathroom floor, crying my eyes and heart out, and I was there because I didn’t want my feelings to “disturb” the people in the house. That was a very low point in my life and nobody should be hiding themselves in their vulnerable moments just because others might not be comfortable with it, or might not know how to deal with it.
“Owning our story can be hard but not nearly as difficult as spending our lives running from it. Embracing our vulnerabilities is risky but not nearly as dangerous as giving up on love and belonging and joy—the experiences that make us the most vulnerable. Only when we are brave enough to explore the darkness will we discover the infinite power of our light.” ~ Brené Brown
It takes lots of courage and strength to show yourself in your most vulnerable moments, and if you have to hide yourself during these moments, then who are you?
For me ENOUGH was enough when I decided that what other people do, say to me and about me, is not a reflection of who I am, but a reflection of who they themselves are. You’ll never be able to make everyone happy and you shouldn’t even have to. We’re all so beautifully different and once we accept one another and stop trying to fit everyone in a mould, that’s when life really gets exciting.
For me ENOUGH was enough when I decided to be free. Free from what other people expect or project onto me, free from what I “should” have already done at my age and why I didn’t do it. Free from the past and the people in it and free from the ideas I had created in my mind about how my life should have been by now.
Sometimes people ask me more personal questions and lately I’ve just been thinking I shouldn’t have to explain whether I’m in a relationship, or why I’m not married, why I don’t have a family yet, and I can go on forever.
My life is mine to live and as long as my choices do not harm anyone, I shouldn’t have to justify any of it to anyone, right?
I do my best to live a life that’s in alignment with my values, in alignment with Love, Discernment, Kindness, and I know I have been challenged and tested this year, but I refuse to give up. I refuse to be bitter instead of better. So I do better with what I have learned from life and do it in such a way that it improves not only my life, but also the lives of those around me.
Here’s to that!
From where I stand right now, I cannot say this journey to living a better life will be smooth, however, what I do know is that no matter what is coming my way, sooner or later, I will be able to get through it. Any life challenge is a life lessons, as long as we are willing to learn and I am.
New research shows that closed-loop technology, or an artificial pancreas, holds huge promise for people living with type 2 diabetes. The technology doubled the amount of time people spent with their blood sugars in the target range and halved the time they spent with high blood sugar levels, compared to using insulin injections.
The results from a world-first trial testing closed-loop technology for the management of type 2 diabetes have been announced by scientists at the University of Cambridge.
Closed-loop systems continuously monitors blood sugars levels. An algorithm calculates the amount of insulin required to keep blood sugars in target range, and then automatically delivers this through an insulin pump.
Most research to date has focused on the benefits of the cutting-edge technology for people with type 1 diabetes. And thanks to decades of clinical trials and a recent NHS pilot roll out of the tech, draft guidance has now been released that could see hybrid closed-loop technology recommended for thousands of people living with type 1.
Many people with type 2 diabetes also need to take insulin to manage their condition, but before technology like this can be made available to people with type 2, we need research to understand if it would be effective and safe.
Unlike the hybrid closed-loops systems that are approved for people with type 1 diabetes, researchers are testing a fully closed-loop system to help manage type 2. The differences between these systems are:
With hybrid closed-loop systems, people with type 1 diabetes need to tell their device what they are about to eat to receive their mealtime insulin dose.
A fully closed-loop system works to control blood sugar levels entirely automatically. This is possible for people with type 2 diabetes because they’re still producing some of their own insulin, which gives a helping hand to the insulin administered by the device.
With our funding, our scientists previously showed that fully closed-loop technology could transform care for people with type 2 diabetes during hospital stays. Now, researchers at the University of Cambridge have studied the system for the first time in people with type 2 diabetes while they used it at home.
Closing in on closed-loop technology
The Cambridge trial involved 26 people living with type 2 diabetes who use insulin. They tested the fully closed-loop system for eight weeks and spent eight weeks on their standard treatment of multiple daily insulin injections and finger-prick tests. The researchers compared blood sugar levels between closed-loop vs standard insulin treatment.
The results of the trial suggest that the technology is a safe and effective way to help people with type 2 diabetes manage their blood sugar levels. The research team found:
People spent on average two-thirds (66%) of their time within the target blood sugar range when using the closed-loop technology – double that while using insulin injections (32%)
People spent one-third (33%) of their time with high blood sugar levels (above 10mmol/L) – this was doubled to 67% when using insulin injections
People had lower average long-term blood sugar (HbA1c) levels of 7.3% after using the closed-loop technology, compared to 8.7% after standard insulin treatment
No one experienced dangerously low blood sugar levels during the study with either treatment.
The team also asked participants about the pros and cons of the tech and the impact it had on their daily life. These results revealed:
Nine out of 10 of those taking part said it meant they could spend less time self-managing their diabetes
Stopping the need for injections or finger-pricks and having greater confidence in managing blood sugar levels were highlighted as key benefits
Downsides included increased anxiety about the risk of hypos (low blood sugar) and annoyances about the practicality of wearing the devices.
First steps to wider access
We’ve long supported research to develop the artificial pancreas and are committed to making sure this technology can benefit as many people with diabetes as possible in the future.
It’s really encouraging to see the research evidence build, which will be required in order to offer this type of technology to some people with type 2 in the future. Before that can happen, we’ll need larger and longer-term studies to confirm the potential benefits and understand the practicalities.
Most of the people who took part in this small trial were White, and everyone lived in the same area – so the study isn’t representative of the wider population of people living with type 2 diabetes.
The group taking part also had an average HbA1c level of 9% at the start of the study, so we don’t know if the tech would be as beneficial for people with type 2 and a lower HbA1c.
It’s also possible that some the benefits seen could be down to participants having access to continuous glucose monitoring for the first time (all were testing with finger pricks previously). So there’s more we need to untangle about which type of diabetes technology could be most helpful and cost-effective for people with type 2.
The research team at the University of Cambridge team now plan to carry out follow-on bigger studies to get more answers.
Cells have evolved a complex network of biochemical pathways, collectively known as the DNA damage response (DDR), to prevent detrimental mutations from being passed on to their progeny. The DDR coordinates DNA repair with cell-cycle checkpoint activation and other global cellular responses. Genes encoding DDR factors are frequently mutated in cancer, causing genomic instability, an intrinsic feature of many tumours that underlies their ability to grow, metastasize and respond to treatments that inflict DNA damage (such as radiotherapy). One instance where we have greater insight into how genetic DDR abrogation impacts on therapy responses is in tumours with mutated BRCA1 or BRCA2. Due to compromised homologous recombination DNA repair, these tumours rely on alternative repair mechanisms and are susceptible to chemical inhibitors of poly(ADP-ribose) polymerase (PARP), which specifically kill homologous recombination-deficient cancer cells, and have become a paradigm for targeted cancer therapy. It is now clear that many other synthetic-lethal relationships exist between DDR genes. Crucially, some of these interactions could be exploited in the clinic to target tumours that become resistant to PARP inhibition. In this Review, we discuss state-of-the-art strategies for DDR inactivation using small-molecule inhibitors and highlight those compounds currently being evaluated in the clinic.
Pancreatic ductal adenocarcinomas are distinguished by their robust desmoplasia, or fibroinflammatory response. Dominated by non-malignant cells, the mutated epithelium must therefore combat, cooperate with or co-opt the surrounding cells and signalling processes in its microenvironment. It is proposed that an invasive pancreatic ductal adenocarcinoma represents the coordinated evolution of malignant and non-malignant cells and mechanisms that subvert and repurpose normal tissue composition, architecture and physiology to foster tumorigenesis. The complex kinetics and stepwise development of pancreatic cancer suggests that it is governed by a discrete set of organizing rules and principles, and repeated attempts to target specific components within the microenvironment reveal self-regulating mechanisms of resistance. The histopathological and genetic progression models of the transforming ductal epithelium must therefore be considered together with a programme of stromal progression to create a comprehensive picture of pancreatic cancer evolution. Understanding the underlying organizational logic of the tumour to anticipate and pre-empt the almost inevitable compensatory mechanisms will be essential to eradicate the disease.
An ED screening program identified patients with undiagnosed prediabetes and type 2 diabetes or undermanaged disease, particularly among racial and ethnic minorities and patients with low income, researchers reported in JAMA Network Open.
“Regarding type 2 diabetes, a few studies have conducted short-term screening of all ED patients,” Kirstie K. Danielson, PhD, associate professor of endocrinology, diabetes and metabolism in the department of medicine at the University of Illinois, Chicago, and colleagues wrote. “To our knowledge, ED screening for type 2 diabetes in underserved populations that built into daily clinical care and uses clinical recommendations has not been developed.”
ED screening can help identify people with undiagnosed prediabetes or type 2 diabetes.
Researchers conducted this pilot program in an ED in Chicago from February to April 2021. Using a best practice alert built into the electronic medical record, researchers identified patients for diabetes screening based on American Diabetes Association criteria: all adults aged 45 years or older, and those aged 18 to 44 years who had a BMI of 25 kg/m2 and no prior diabetes diagnosis and no HbA1c record for the past 3 years. Of 8,441 total patients who visited the ED, 1,085 were flagged as at risk for type 2 diabetes. Of these patients, 758 had prediabetes, 265 had diabetes and 62 had severe diabetes.
Researchers were able to follow-up with 352 of these patients for HbA1c information: 264 with prediabetes (mean age, 51.7 years; 56.8% women) and 88 with type 2 diabetes (mean age, 53.8 years; 47.7% women). Overall, 19.6% of patients were Hispanic, 64.8% were non-Hispanic Black, 9.7% were non-Hispanic white and 6% were non-Hispanic of other race.
Median income of all patients’ ZIP codes was at the 44th percentile of U.S. income. In addition, 50% of patients had public insurance and 4% were uninsured. Of note, 25% of patients self-reported that they were diagnosed with prediabetes or type 2 diabetes before the study, but only 58% reported receiving treatment for their disease, according to the researchers.
“The pilot sample reached by telephone was likely biased toward higher socioeconomic status, indicating those not reached are more likely underserved,” the researchers wrote. “Next steps involve testing implementation strategies to link these new patients to diabetes education and care.”
Caffeine (CAF) is a well-documented performance aid ingested by athletes either before or during exercise. The acute performance benefits have been reviewed previously across a range of activities including muscular strength/power (Warren et al., 2010), anaerobic power (Grgic, 2018), and endurance (Conger et al., 2011; Doherty & Smith, 2004; Graham, 2001). In general, the mechanism by which CAF appears to reduce fatigue has been ascribed to influence metabolism of substrate (e.g., fat) and/or the central nervous system via adenosine antagonism. Other purported potential neuromuscular effects include direct effects on muscle via intracellular calcium (Herrmann-Frank et al., 1999), increased motor unit recruitment (Warren et al., 2010), and/or central nervous system activation (Kalmar & Cafarelli, 2004; Warren et al., 2010). However, from the historical perspective, the metabolic theory was initially advanced with classic studies (Costill et al., 1978; Ivy et al., 1979), indicating endurance performance improvements appeared linked to greater fat oxidation and/or increased lipolysis which, in turn, might delay fatigue by sparing endogenous stores of carbohydrate. The latter assumption has been disassociated as the basis of ergogenic benefits during exercise (Jeukendrup & Randell, 2011).
The metabolic theory of increased fat oxidation with CAF during exercise persisted for decades (Graham, 2001; LeBlanc et al., 1985) until more recent studies suggested that, in fact, the opposite might occur (i.e., increased carbohydrate metabolism; Graham et al., 2008; Yeo et al., 2005) following CAF administration. Furthermore, it was suggested (Graham et al., 2008) the ergogenic benefits of CAF may not be the result of shifts in either carbohydrate or fat metabolism; although, this does not rule out the possibility that fat metabolism is augmented with CAF. A recent meta-analysis on 19 studies (Collado-Mateo et al., 2020) indicated CAF increased fat metabolism during exercise based on whole-body gas exchange variables (e.g., respiratory exchange ratio [RER] and calculated fat oxidation rates) but that fitness level modulated this effect (i.e., CAF had less effect in trained individuals who may have higher fat oxidative capacity during exercise). However, these findings contrast an earlier meta-analysis that found no effect of CAF on RER during exercise while increasing blood glucose and lactate (Glaister & Gissane, 2018). Thus, despite two meta-analyses on the topic, the fat metabolic theory as a physiological effect of CAF during exercise remains debatable. Several studies have also reported enhanced fat metabolism after consuming CAF under resting conditions (Acheson et al., 2004; Bellet et al., 1965, 1968; Jo et al., 2016), suggesting the metabolic equivalent of tasks level (from rest to low-intensity exercise) may be an important mediating factor. Moreover, the methods used to assess fat metabolism vary, with some studies reporting blood biomarkers of lipolysis and others relying exclusively on whole-body gas exchange data. Other factors related to the research design may also impact the degree of CAF’s effect on fat metabolism. These include the CAF dose administered and individual variability in the response to CAF, specifically when comparing men to women who may rely on fat metabolism to a greater degree (Cano et al., 2022).
Although previous reviews (Guest et al., 2021) and meta-analyses (Grgic et al., 2020; Pickering & Kiely, 2019) have reported effects of CAF on exercise performance, few (Collado-Mateo et al., 2020; Glaister & Gissane, 2018) have quantified the effect of CAF on fat metabolism during exercise. Inexplicably, those two aforementioned studies do not agree, despite basing conclusions solely on gas exchange data. No meta-analysis to our knowledge has determined CAF’s impact based upon the metabolic equivalent of tasks level (inclusive of rest upwards to higher exercise intensity) or utilized additional biomarkers of fat metabolism (i.e., blood parameters). Therefore, our purpose was to determine effects of CAF ingestion on fat metabolism using a comprehensive systematic review of the published literature and meta-analysis. We also sought to quantify the influence of factors moderating this effect such as the biomarkers assessed, rest compared with exercise, CAF dosage, and participant characteristics.
Methods
Systematic Literature Review
For this study, the preferred reporting items for systematic reviews and meta-analyses guidelines were followed (Moher et al., 2015). The electronic databases PubMed, SPORTDiscus, and Web of Science were searched through December 31, 2021 using the search terms: CAF AND (fat OR lipid) AND (metabolism OR oxidation). In addition, reference lists from each relevant study and review articles were examined for inclusion of additional studies in the analysis.
Inclusion/Exclusion Criteria
Studies meeting the following criteria were included in the analysis: (a) published in a peer-reviewed journal, (b) human participants free from any medical condition known to alter metabolic rate, (c) crossover study design that included both a CAF and placebo condition, and (d) reported some method of fat metabolism providing means and variances. Studies that included additional substances during CAF conditions were included if the investigational and placebo conditions were identical with the exception of CAF. Studies reporting either resting, exercise conditions, or both in the same study were included in the systematic review. Data were excluded if: (a) exercise was not primarily aerobic, (b) CAF/placebo were consumed < 30 min prior to data collection, or (c) CAF/placebo were not ingested/swallowed (i.e., mouth rinse or chewing gum). We defined aerobic exercise as ≥ 5 consecutive min of activity since > 80% of energy is supplied by the aerobic energy system (Gastin, 2001).
A total of 149 articles were identified for potential analysis. The review and selection process for identification of the included articles are summarized in Figure 1. After full-text review, 94 studies were retained and 55 studies excluded based on: did not report fat metabolism data, not a within-subjects study design, and missing placebo condition. Preferred reporting items for systematic reviews and meta-analyses guidelines, study quality assessment, and study methods are available in the Supplementary Material S1 (available online) and the Supplementary Table S1 (available online).
Figure 1
Selection of articles for meta-analysis of fat metabolism when consuming CAF. CAF = caffeine.
Citation: International Journal of Sport Nutrition and Exercise Metabolism 2023; 10.1123/ijsnem.2022-0131
Study data were extracted from text or relevant tables. If data were not reported elsewhere, figures were used for data extraction. Figures were enlarged, and the mean and variance data presented were measured to the nearest millimeters using the appropriate scale of the figure. Data from each study were converted into the same format by calculating the effect size (ES) as the standardized difference in means. The standardized difference in means was calculated as:
(MCAF−MPla)SDPooled,
where M is the mean, and SDPooled is the pooled SD (Borenstein et al., 2009) and calculated as:
where rCAF,Pla was the intertrial correlation between CAF and placebo conditions (Borenstein et al., 2009). In three study populations, we calculated rCAF,Pla from the reported data (Bellet et al., 1965; Wiles et al., 1992). For studies in which the correlations were not available, the mean of the reported correlations was used (r = .474 for exercise and r = .580 for resting studies). Hedges correction (Hedges’ g) was used to account for potential bias resulting from small sample sizes. Standardized difference in means and SE were multiplied by the correction factor (Borenstein et al., 2009):
1−{3[4×(nCAF,Pla−1)]}.
Other data extracted from each study included: authors; publication year; participant demographic information (sex, age, height, body mass); maximal oxygen uptake (VO2max); fasting state; CAF dose; fat metabolism biomarker; timing of data measurements; exercise intensity; exercise testing protocol; habitual CAF use; timing of CAF administration; and dietary control methods.
In studies that reported more than one fat metabolism outcome from the same population of participants, the mean study ES and their associated variances were used to calculate the meta-analyses’ overall ESs for each study. When a study reported data for more than one independent group, an ES was calculated for each group. Each independent group was then treated as an independent study (Borenstein et al., 2009). In the meta-analysis by fat assessment method, multiple methods were often utilized within the same study. In these cases, each method was analyzed independently. For steady state, submaximal exercise protocols, mean data were used in the calculation of the ES. In studies that reported data during different intensities, the ES was calculated for each intensity. In both cases, the average ES across all data points was used to calculate the overall ES for a given study.
Overall ESs were calculated using a random-effects model that accounts for true variation in effects occurring from study to study as well as random error within a given study. Heterogeneity was assessed using Q and I2 statistics. To assess whether moderator variables could explain variation in ES among studies, subgroup meta-analyses and meta-regressions (method of moments model) were conducted. Subgroup meta-analyses examined effects of categorical data: rest versus exercise, fat metabolism assessment method (blood vs. gas exchange based upon RER; Zuntz, 1901), CAF dosage (small, moderate, and large; Pickering & Kiely, 2019), exercise intensity, participants’ sex, habitual CAF use (yes or no without threshold levels), or fasted state (≥3 hr; Jeukendrup et al., 1998). Gas exchange data were reported as RER (ratio of carbon dioxide production to oxygen consumption) or by calculating fat oxidation in grams per minute based on oxygen consumption from standardized formulas (Zuntz, 1901). Meta-regressions also assessed the association between CAF ES for fat metabolism relative to continuous data (CAF dosage, body mass index [BMI], fitness level based on VO2max, age, and exercise intensity).
Most studies reported approximate values for exercise intensity, typically using percentage of VO2max (%VO2max). For studies that did not report exercise intensity, we based our estimate from the exercise description provided by the authors (see Supplementary Table S1 [available online]). To determine the intensity during resting conditions, if oxygen consumption data were not available, one metabolic equivalent of tasks (i.e., 3.5 ml·kg−1·min−1) was used as the estimated metabolic rate. If VO2max data were available, the intensity was then calculated (e.g., resting value of 3.5 ml·kg−1·min−1 ÷ maximal value of 45 ml·kg−1·min−1 = 8%).
The effect of publication bias was addressed by combining a funnel plot assessment with the Duval and Tweedie (2000) trim and fill correction. Orwin’s Fail-Safe N test determined the number of missing studies that would have been needed to bring the overall ES down to a level favoring the placebo condition for fat metabolism (Borenstein et al., 2009).
All data were presented as mean ± 95% confidence interval (CI). ES thresholds of |0.2|, |0.5|, and |0.8| were considered small, medium, and large, respectively (Cohen, 1988). An α level of .05 was used to indicate statistical significance. All calculations were completed using comprehensive meta-analysis (version 2.2.064, Biostat).
Results
Study Characteristics
Ninety-four studies published between 1965 and 2021 were included. In 11 studies, data from two independent populations were presented, for a total of 105 independent study populations and 435 separate ESs. Data from five different measures assessing fat metabolism were presented: plasma free fatty acids (FFAs), plasma glycerol, triglycerides, RER, and fat oxidation calculated from RER (gas exchange data). Fifty-five percent of studies presented data using more than one method to assess fat metabolism. Most studies (63%) reported participants in a fasted state ≥ 3 hr from last meal (mean duration: 7.1 hr, median: 8 hr). CAF dosage used in the studies varied considerably, averaging 5.7 mg/kg (median: 5.0 mg/kg, range: 1.0–15.0 mg/kg).
Participant Characteristics
Data from 984 participants were included (828 males/146 females). Most studies utilized relatively small sample sizes (mean n = 9.4, median: 9, range: 5–24). In 72% of studies, all participants were males, 9% of studies consisted of only females, and 18% of studies included both males and females presented combined. In studies that combined males and females, ∼70% of participants were males. One study did not identify sex (Wiles et al., 1992). In general, the average participant was young adult (mean age: 26.1 years), lean (mean BMI: 23.7 kg/m2), and fit (mean VO2max: 54.1 ml·kg−1·min−1). However, there was variation across a range (age: 15.6–71 years, BMI: 18.3 to 29.6 kg/m2, VO2max: 27.6 to 75.5 ml·kg−1·min−1).
Fat Metabolism With CAF Consumption
Of the 105 study populations that reported fat metabolism after ingesting CAF, overall ESs ranged from −2.36 (greater fat metabolism with placebo) to 3.87 (greater fat metabolism with CAF; see Supplementary Figure S1 (a–c) [available online]). Overall, the ES was 0.39 (95% CI [0.30, 0.47], p < .001), reflecting a small effect of CAF on fat metabolism (Figure 2A). There was significant heterogeneity across studies, Q(104) = 315.22, p < .001. The within-study heterogeneity was moderate (I2 = 67.0%), while the between-study heterogeneity was low (τ2 = .12).
Figure 2
Summary ES of the subgroup meta-analyses examining the effects of CAF on fat metabolism during rest and exercise. The center of each diamond reflects the mean ES, while the width of the diamond represents the 95% CI. CAF = caffeine; ES = effect size; CI = confidence interval. *Significant difference between methods (p = .02).
Citation: International Journal of Sport Nutrition and Exercise Metabolism 2023; 10.1123/ijsnem.2022-0131
Subgroup meta-analyses were used to assess effects of moderator variables as potential underlying explanation for the heterogeneity.
Resting Versus Exercise Conditions
Of the 105 independent study populations, data during resting conditions were reported in 13 studies, data during exercise conditions in 34 studies, and during both resting and exercise conditions in 58 studies. A total of 71 and 92 independent ESs were reported for rest and exercise, respectively. Across all studies, ES for fat metabolism during both rest (ES = 0.51, 95% CI [0.41, 0.62], p < .001) and exercise (ES = 0.35, 95% CI [0.26, 0.44], p < .001) conditions were significantly increased with CAF; however, the ES for rest was greater versus exercise, Q(1) = 5.33, p = .02, (Figure 2B). ES for fat metabolism reporting both rest (ES = 0.49, 95% CI [0.37, 0.60], p < .001) and exercise (ES = 0.44, 95% CI [0.33, 0.56], p < .001) in the same study were increased with CAF, but not different between rest and exercise, Q(1) = 0.26, p = .61.
Meta-regression was also completed for CAF ES on fat metabolism relative to exercise intensity (%VO2max) for combined rest and exercise data. This inverse relationship was significant with a slope of −0.003 (95% CI [−0.004, −0.001], p < .001), indicating a slight decrease in fat metabolism as exercise-intensity increases above rest. Meta-regression completed on only the exercise studies found an inverse relationship but it was not statistically significant (slope = −0.002, 95% CI [−0.006, 0.002], p = .32).
Fat Metabolism Assessment Method
Five different fat metabolism biomarkers were reported across studies. The most common method reported was RER (n = 77), and least common was triglycerides (n = 9). CAF significantly increased fat metabolism based upon FFA, glycerol, RER, and calculated fat oxidation with ESs ranging from 0.19 (RER) to 0.56 (glycerol, FFA; p < .001) but not based on triglycerides (ES = 0.30, 95% CI [−0.02, 0.62], p = .07; Figure 3A). The ESs based on RER were small and significantly lower compared with the ES using FFA and glycerol, Q(4) = 23.54, p < .05. There were no other significant differences between fat metabolism assessment methods.
Figure 3
Summary ES of the subgroup meta-analyses examining the effects of CAF on fat metabolism by (A) fat assessment method and (B) blood lipolysis metrics versus gas analysis metrics. The center of each diamond reflects the mean ES, while the width of the diamond represents the 95% CI. CAF = caffeine; ES = effect size; CI = confidence interval; FFA = free fatty acid; RER = respiratory exchange ratio. *Significant difference between methods (p < .05).
Citation: International Journal of Sport Nutrition and Exercise Metabolism 2023; 10.1123/ijsnem.2022-0131
Biomarkers used to assess fat metabolism were then categorized by lipolytic blood measures (at least one of either FFA, glycerol, or triglycerides across 64 studies) versus gas analysis (RER and/or fat oxidation in 84 studies). ESs using blood biomarkers (ES = 0.55, 95% CI [0.43, 0.67], p < .001) and gas analysis (ES = 0.26, 95% CI [0.16, 0.37], p < .001) were significantly greater than zero (Figure 3B), although blood biomarkers ESs were greater, Q(1) = 12.61, p < .001. In 43 studies including both blood and gas analysis measures, ES for blood measures (ES = 0.58) remained significantly larger than gas exchange (ES = 0.28), Q(1) = 7.07, p = .01.
Other Potential Modifier Variables
Figure 4 summarizes the impact of other factors on CAF ES on fat metabolism. When assessed by sex, CAF naive or regular user, CAF dosage, or fasted status prior to testing, all subgroup ESs were significantly different from zero (favoring increased fat metabolism with CAF). Studies with men (ES = 0.40, 95% CI [0.30, 0.50]), men and women combined (ES = 0.37, 95% CI [0.17, 0.56]), and only women (ES = 0.34, 95% CI [0.03, 0.65]) had significant ES with CAF (p < .05; Figure 4A) with no differences between subgroups (p = .90). There were also no differences within moderator variables: habitual CAF use (Figure 4B), CAF dosage (Figure 4C), or fasting condition (Figure 4D). Meta-regression evaluated these variables as continuous data relative to ES: BMI (slope = 0.020, 95% CI [−0.021, 0.061], p = .33), age (slope = 0.000, 95% CI [−0.009, 0.009], p = .95), VO2max (slope = −0.005, 95% CI [−0.012, 0.001], p = .11), and CAF dosage (slope = 0.002, 95% CI [−0.024, 0.027], p = .90), which were also not statistically significant.
Figure 4
Summary ES of the subgroup meta-analyses examining the effects of CAF on fat metabolism by (A) sex, (B) habitual CAF use, (C) CAF dose, and (D) fasting state. The center of each diamond reflects the mean ES, while the width of the diamond represents the 95% CI. CAF = caffeine; CI = confidence interval; ES = effect size.
Citation: International Journal of Sport Nutrition and Exercise Metabolism 2023; 10.1123/ijsnem.2022-0131
Publication bias was assessed by examining a funnel plot of SE versus ES. Minor asymmetry was noted in the plot; thus, a Duval and Tweedie’s (2000) trim and fill correction to the overall ES was calculated. This correction shifted the overall ES from 0.39 (95% CI [0.30, 0.47], p < .001) to 0.25 (95% CI [0.16, 0.35], p < .001; Figure 5), which did not change interpretation of results (small ES with CAF). Using the Orwin’s Fail-Safe N test to reduce the overall ES down to a trivial negative overall ES (i.e., ES = −0.10), we assumed that the missing studies had a mean ES of −0.20. Given these criteria, the ES of 474 independent groups (compared with 105 retrieved) would have theoretically been needed to be omitted from our search to conclude fat metabolism is not increased with CAF versus placebo.
Figure 5
Funnel plot of the ES of CAF on fat metabolism versus the SE. The observed studies are shown as open circles and the observed ES is presented as the open diamond. The Trim and Fill adjustment is presented with the imputed studies as filled circles and the mean imputed ES as a filled diamond. The vertical line on the graph represents the mean imputed ES, and the angled outer lines represent the 95% confidence intervals. CAF = caffeine; ES = effect size.
Citation: International Journal of Sport Nutrition and Exercise Metabolism 2023; 10.1123/ijsnem.2022-0131
Our aim was to determine whether CAF increases fat oxidation. In our analysis of 94 studies with 105 independent groups (984 participants), CAF ingestion significantly increased fat metabolism with a small effect (ES = 0.39) based upon gas exchange and blood parameters. The increase in fat metabolism tended to be greater when consumed during rest compared with exercise, although both conditions significantly elevated fat metabolism. Unlike a previous meta-analysis (Collado-Mateo et al., 2020) which only included 19 exercise studies, we found this effect to be independent of various individual factors including fitness level, sex, and CAF dosage.
In the present study, our subgroup analysis comparing rest to exercise conditions (Figure 2B) suggests that the impact of CAF on fat metabolism may be more definitive under resting conditions. It is well known that fat oxidation decreases as exercise intensity increases, consistent with a greater reliance on carbohydrate (Glaister & Gissane, 2018). For the studies under resting conditions included in our analysis, most (63%) were reported under fasting conditions. These conditions might optimize fat metabolism regardless of participants’ fitness level or sex as these factors may contribute to greater variability among individuals’ metabolic response during exercise (particularly as intensity increases). Because of energy requirements at rest and low-intensity exercise, >90% of the energy are supplied from fat sources as compared with the shift to carbohydrate oxidation (>90% of energy) during high-intensity exercise (Romijn et al., 1993). Maximal fat oxidation rates are considered to be between 59% and 64% of VO2max in trained individuals but lower (47%–52% of VO2max) in the general population (Achten & Jeukendrup, 2004). Our results suggest the original metabolic theory with CAF ingestion is valid while under both rest and exercise, but prescribing an “optimal” intensity for enhancing fat metabolism may be less definitive across the exercise spectrum with different populations.
Fat metabolism has historically been measured using biomarkers related to lipolysis in the blood (i.e., FFA, glycerol) or indicators of whole-body substrate oxidation using gas exchange at steady state conditions (RER and calculations of fat oxidation). Breakdown of triglyceride occurs in many tissues of the body providing FFA which can be utilized endogenously for energy production except in adipose tissue which releases FFA and glycerol to supply nonadipose tissues (Schweiger et al., 2014). Since fat may be oxidized within skeletal muscle during exercise, the most optimal and sensitive methods to assess blood markers of lipid oxidation continue to evolve (Schweiger et al., 2014). In the present study, all methods reportedly linked to fat oxidation (with the exception of blood triglycerides) increased after consuming CAF. Blood triglycerides were also the least commonly reported measure (9% of studies) and may be less physiologically relevant. However, expressing fat metabolism using blood biomarkers (including triglycerides) yielded a significantly higher ES than gas exchange measures (RER and calculated fat oxidation) (Figure 3B). The ES based on blood biomarkers across all studies was moderate (ES = 0.55). In studies reporting gas exchange data, a majority of the studies demonstrated a positive ES. In those studies reporting both measures, this difference between lipolytic blood markers and gas exchange was further confirmed (Figure 3C). Therefore, while fat metabolism increased after consuming CAF based upon either blood biomarkers or gas exchange data, blood lipolytic biomarkers elicited more consistent changes. We can only speculate a reason for this discrepancy but perhaps is linked to concomitant increases in glycogenolysis (simultaneously influencing carbohydrate oxidation) with CAF.
Numerous studies have reached the opposite conclusion regarding metabolic effects of CAF when assessed based upon gas exchange variables: either no change or significant decreases in fat metabolism after ingesting CAF. While CAF likely mobilizes fatty acids from adipose tissue, RER measures do not consistently indicate increased fat oxidation during exercise (Glaister & Gissane, 2018). Furthermore, there is little evidence to support the hypothesis that CAF exerts its ergogenic effect due to enhanced fat oxidation (Graham et al., 2008). In contrast, a recent meta-analysis (Collado-Mateo et al., 2020) found a significant but small ES for RER during exercise (ES = −0.33), a magnitude remarkably similar to our gas exchange data in the present meta-analysis (ES = 0.26). Our values were expressed in the positive direction as increased fat oxidation unlike the former (Collado-Mateo et al., 2020), which report ES for RER as negative values (indicative of decreased RER). Both meta-analyses contradict a previous one (Glaister & Gissane, 2018) indicating RER during exercise was not significantly impacted by CAF. Exercise studies in that meta-analysis (Glaister & Gissane, 2018) were delimited to 5–30 min bouts of 60%–85%VO2max and also reported higher blood glucose and lactate with CAF dosages between 3 and 6 mg/kg. Inclusion criteria for the previous two meta-analyses of RER data resulted in two very different sets of studies, which may account for the differential findings between them. Of the combined 33 studies included between the two meta-analyses, only three studies were common to both (Collado-Mateo et al., 2020; Glaister & Gissane, 2018). In the present meta-analysis, 77 of 94 studies reported RER data. All but two of the studies included in these earlier meta-analyses were included in our analysis.
The metric used to assess fat metabolism after consuming CAF could be critical in the interpretation of results, particularly when measures do not align within studies. One study (Yeo et al., 2005) found CHO metabolism significantly increased (and fat oxidation decreased) during exercise at 64%VO2max after CAF. Increased CHO metabolism was based on RER data; however, FFA and glycerol suggested a nonsignificant increase in fat metabolism. These seemingly contradictory findings of decreased fat metabolism reported by gas analysis data while blood biomarkers suggest increased lipolysis were reported by others (Casal & Leon, 1985; Lee et al., 2012; Spriet et al., 1992; Wells et al., 1985) with authors’ interpretation varying. While not mechanistic, our findings suggest the method used can yield differential results regarding fat metabolism after ingesting CAF and should be considered when interpreting CAF’s effect.
Unlike the recent meta-analysis (Collado-Mateo et al., 2020), we did not find a CAF dose–response effect on fat metabolism. Those authors reported the ES for fat metabolism was significantly higher for “threshold” CAF doses above 3 mg/kg, although not a true dose–response since > 6.0 mg/kg did not exhibit a greater ES. However, a high degree of variability (I2 = 92%) was reported specifically in their subgroups comparing the high CAF dose (6 mg/kg). The number of studies in their low dose (< 3 mg/kg) was also more limited (n = 5) than in our present meta-analysis (n = 18). In contrast, we found no dose–response effect of CAF on fat metabolism or a minimum 3 mg/kg “threshold level effect.” All CAF doses demonstrated increased fat metabolism over placebo (p < .05) with no apparent benefit from consuming larger CAF doses (Figure 4c). When two or more CAF doses were investigated in the same study (see Supplementary Table S1 [available online]), there was no clear dose–response effect with CAF dosage ranging from 1.0 to 15.0 mg/kg. Dose–response studies did not appear in the literature until 1995 (Spriet, 2014), and doses of ∼3 mg/kg were commonly considered “low” dose. Seven of the 12 studies included doses of 3.0 mg/kg or less, and six studies included doses of 6.0 mg/kg or greater. We speculate that by including resting studies, the impact of CAF on fat metabolism may be less influenced by other potential factors at play during exercise (intensity, participant fitness level) and enhance the possibility to elicit more consistent metabolic effects at “lower” CAF dosages (∼3 mg/kg). To that end, a CAF dosage of only 100 mg has been shown to increase resting energy expenditure by 3%–4% although fat oxidation was not measured (Dulloo et al., 1989). The lack of a clear CAF dose–response effect has also been previously demonstrated related to endurance performance (Conger et al., 2011) and ratings of perceived exertion (Doherty & Smith, 2005), although (Spriet, 2014) suggests higher CAF doses, while not needed for central nervous system antagonism of adenosine (i.e., influencing performance and perceived exertion), might be necessary for metabolic actions (e.g., lipolysis). Additional investigations with multiple CAF dosages (particularly at the low end) may prove beneficial in our understanding and alter the present findings.
Strengths and Limitations
With 105 different participant populations and nearly 1,000 participants included in the analysis, this large sample size allowed for a number of important subgroup analyses to address several key moderator variables considered important for assessing the impact of CAF. However, there are inherent limitations related to risk of bias. Our search did not include unpublished or non-English studies, thus making it likely we did not capture every relevant study on fat metabolism after CAF ingestion within the gray literature. While omission of relevant studies may have altered the individual ESs, we do not believe that it would have significantly impacted our overall conclusions based on the Orwin’s Fail-Safe N and Duval–Tweedie tests (Figure 5).
Another limitation of our approach is that the ergogenicity of CAF for exercise performance cannot be tied to fat oxidation as the underlying mechanism. Of interest, however, is emerging evidence that low doses (< 3 mg/kg) may be ergogenic and our results found that fat oxidation occurs similarly with low versus moderate doses. The exercise protocols used in each study also varied considerably. Since mean values were utilized to compute ES, this approach may limit the ability to interpret results during specific exercise conditions. Increases in lipolytic biomarkers do not always align with increased fat oxidation as referenced earlier. A strength of our analysis was for studies that measured both gas exchange and lipolytic markers (Figure 3C), results suggest lipolysis occurs to a moderate degree while RER decrease may be tempered. Whether this differential effect is potentially due to concomitant increases glycogenolysis with CAF (and reports of increased carbohydrate metabolism) which offset the relative contribution of fat substrate being oxidized is unclear since we did not systematically extract measures of carbohydrate oxidation.
Practical Applications
Understanding factors that increase fat oxidation are important not only for optimizing exercise performance but also for clinically relevant conditions such as reducing obesity and metabolic syndrome (Achten & Jeukendrup, 2004). That CAF increased fat oxidation in women (similar to men) and was not dependent on fitness level would suggest metabolic advantages in weight control for sedentary populations, especially since the rest effect was equal to or greater than exercise of varying intensities. Exercise intensity and duration both impact fat oxidation, but the optimal intensity remains obscure (Achten & Jeukendrup, 2004). Our results suggest exercise coupled with CAF (even at low dosages) may enhance fat oxidation, potentially providing metabolic advantages. This statement concurs with significant ES observed with CAF on weight control variables (lowered body mass, fat mass, and BMI) with CAF (Tabrizi et al., 2019). However, we acknowledge generalizations are challenging due to the large interindividual variability in substrate utilization (Achten & Jeukendrup, 2004). Despite the backdrop of individual variability related to several factors, our meta-analysis finds CAF increases fat oxidation across a range of CAF dosages and individual characteristics.
Conclusions
Based upon 94 studies with variable findings regarding fat metabolism after ingesting CAF under both resting and exercise conditions, we report a highly significant but small effect (ES = 0.39) of CAF to increase fat metabolism. The ES of CAF was at least equal to or greater during rest compared with exercise and robust regardless of participants’ sex, fitness level, habitual CAF use, fasted state, or CAF dosage. However, the ES was lower when studies utilized methods based upon whole-body gas exchange analysis compared with lipolytic blood parameters (e.g., glycerol, FFA). Therefore, the fat metabolic theory for CAF for exercise (and rest) remains viable based on this systematic review of the literature and meta-analysis.