Introduction
An increasing number of studies world wide provide compelling evidence for the excess cardiovascular (CV) risk in patients with rheumatoid arthritis (RA) compared with the general population.1 2 The interplay of two major contributors (traditional CV risk factors and inflammation) is being investigated to better understand the mechanisms underlying the high CV morbidity and mortality in RA. The contribution of inflammation to atherogenesis is supported by epidemiological evidence on the independent predictive value of inflammatory markers for subclinical and clinical atherosclerosis and for associated CV events.3,–,5 However, the impact of lipids on CV risk in the chronic autoimmune inflammatory setting of RA is unclear and the literature on lipid profile in patients with RA is contradictory. A number of studies have demonstrated a proatherogenic profile in RA.6,–,9 Some authors did not find a significant difference between lipid levels in patients with RA and in the general population.10 On the other hand, growing evidence suggests that patients with active untreated RA have reduced total cholesterol (TC), low-density lipoprotein (LDL) and high-density lipoprotein (HDL) cholesterol.11,–,13 These conflicting results can be attributed to confounding by indication and, possibly, to the effect of inflammation and treatment. Comprehensive analyses of trends in lipids both before and after RA incidence are lacking and the impact of RA onset on lipids is unknown. To examine this subject, we performed a longitudinal study of changes in lipid profile during the period surrounding RA incidence in a population-based cohort of patients with RA and a comparison cohort of non-RA subjects.
The aim of this study was to compare lipid profiles in patients with RA and non-RA subjects during the 5 years before and 5 years after the RA incidence/index date.
Methods
This retrospective longitudinal cohort study was performed using the population-based resources of the Rochester Epidemiology Project (REP) medical records linkage system. The unique features of the REP with respect to epidemiological studies are described in a number of publications.14,–,16 Briefly, this records linkage system allows ready access to the complete medical records from all healthcare providers from the Mayo Clinic and its affiliated hospitals, the Olmsted Medical Center, the Olmsted Community Hospital, local nursing homes and the few private practitioners. The potential of this data system for population-based studies has been described elsewhere.16 This system ensures virtually complete ascertainment of all clinically recognised cases of RA among the residents of Olmsted County, Minnesota, USA.
The study population comprised a retrospectively identified incidence cohort of patients with RA who were Olmsted County, Minnesota residents ≥18 years of age and first met the 1987 American College of Rheumatology (ACR) criteria17 between 1 January 1988 and 1 January 2008 and had at least one lipid measurement during the time period from 5 years before to 5 years after the RA incidence date. Subjects with only one lipid measure do not contribute to the estimation of trends (ie, slopes), but they do contribute information to the mean lipid levels and thus were included. The RA incidence date was defined as the earliest date at which the patient fulfilled four or more ACR criteria for RA.
For each patient with RA, a non-RA subject of similar age, sex, calendar year and length of medical history before the index date was selected from the same population. Every person in the community ≥18 years of age who qualified during the defined period regardless of race, ethnicity or socioeconomic status was equally eligible for inclusion. Each non-RA subject was assigned an index date corresponding to the RA incidence date of the designated patient with RA.
The original and complete medical records of all subjects were reviewed longitudinally by trained nurse abstractors, supervised by the principal investigator. Information about demographics (age and sex) and RA disease characteristics (disease duration and rheumatoid factor seropositivity) was collected.
All lipid measures (TC, HDL, LDL and triglycerides (TGs)) obtained from 5 years before the RA incidence/index date to the last follow-up were abstracted. In accordance with Adult Treatment Panel III guidelines,18 abnormal lipid levels were defined as TC ≥6.2 mmol/l (≥240 mg/dl), LDL ≥4.1 mmol/l (≥160 mg/dl), TGs ≥2.3 mmol/l (≥200 mg/dl) or HDL <1.0 mmol/l (<40 mg/dl). Data on prescription of lipid-lowering drugs (ie, statins and other lipid-lowering drugs) were available for 1017/1117 (91%) subjects from 1997 to the present. Extensive height and weight data were also available from 1997 to the present and were used to calculate body mass index (BMI). The study protocol was approved by the Institutional Review Boards from Mayo Clinic and Olmsted Medical Center.
Statistical methods
Descriptive statistics (means, percentages, etc) were used to summarise the lipid measures in the patients with RA and non-RA subjects. Demographics of patients with RA and non-RA subjects, as well as subjects with and without lipid measures, were compared using χ2 tests and t tests. Random-effects models adjusting for age, sex and calendar year of the RA incidence/index date were used to analyse the trends in lipid profiles during the time period from 5 years before to 5 years after the RA incidence/index date. These models account for multiple measurements for each subject using random effects to fit individual intercepts and slopes for each subject. Furthermore, these models were used to estimate the percentage of patients with RA and non-RA subjects with abnormal lipid measures before and after the RA incidence/index date, as well as to examine the trends in BMI over the time period. Generalised additive models with smoothing splines were used to illustrate the trends in lipid levels over time.
Sensitivity analyses, in which the original analyses were repeated under slightly different conditions, were performed to examine the change in results when (a) using the date of first joint swelling instead of the date of fourth criteria as the index date and (b) excluding patients using statins.
Results
A total of 650 Olmsted County, Minnesota residents first met the ACR criteria for RA between 1 January 1988 and 1 January 2008. Of these, 577 patients had at least one lipid measure during the time period from 5 years before to 5 years after the RA incidence date and thus were included in the study. The total number of lipid measurements in patients with RA was 3088 (median four measurements for each patient). Patients with RA without lipid measures during the time period of interest (n=73)had similar sex and rheumatoid factor status to those with lipid measures. However, patients with RA without lipid measures were younger (mean age 47.9 years, p<0.001) than patients with RA with lipid measures. Within the same time period, lipid measurements were also available for 540 non-RA subjects with a total of 3048 lipid measurements (median four measurements for each subject). The spread of measurements was similar for both groups (mean 5.4 years, SD 3.0 years for RA and mean 5.8 years, SD 3.2 years for non-RA (p=0.49)). Non-RA subjects had similar age and sex characteristics to those of patients with RA with lipid measures.
Demographic characteristics and the length of follow-up were similar in both RA and non-RA subjects (table 1). The median follow-up was 5 years in each cohort as the follow-up was truncated at 5 years for these analyses. A full 5 years of follow-up after the RA incidence/index date was available in 373 (65%) patients with RA and 377 (70%) non-RA subjects. In addition, 531 (92%) RA and 496 (92%) non-RA subjects had 5 years of available information before the RA incidence/index date. The mean time before the RA incidence/index date was 4.8 years in both groups with a median of 5 years.
Characteristics of patients with RA and non-RA subjects
Figure 1 shows the trends in lipids during the 5 years before and 5 years after the RA incidence/index date in the RA and non-RA cohorts. There was a significant decline in TC and LDL levels during the 5 years before the RA incidence/index date in the RA, but not in the non-RA cohort. During the 5 years after the RA incidence/index date, the trends in TC and LDL levels were similar in RA and non-RA cohorts. HDL and TG levels in patients with RA and non-RA subjects did not change significantly during the entire study period of 5 years before and 5 years after the RA incidence/index date (figure 1).
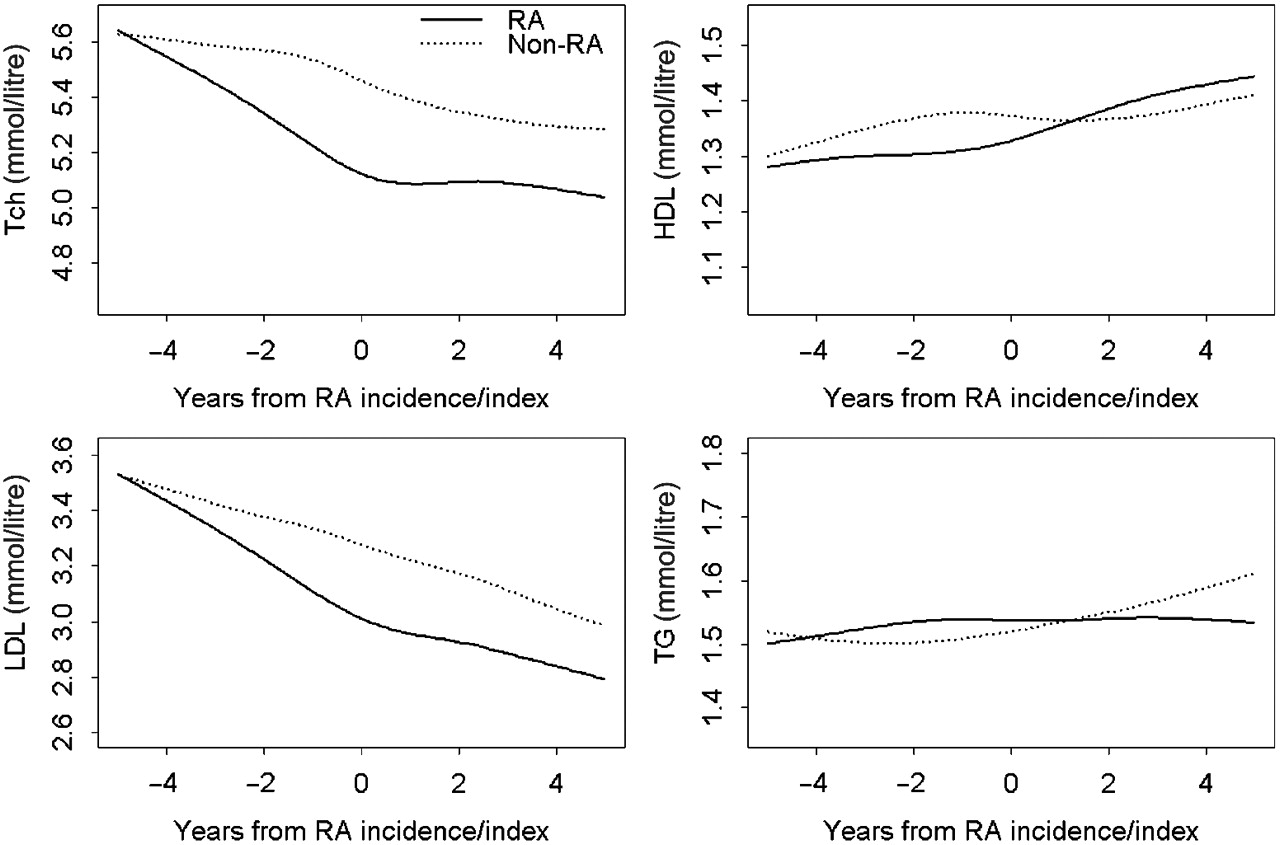
Trends in lipid levels in patients with rheumatoid arthritis (RA) and non-RA subjects during the time period from 5 years before to 5 years after the RA incidence/index date adjusting for age, sex and calendar year of RA diagnosis. HDL, high-density lipoprotein; LDL, low-density lipoprotein; Tch, total cholesterol; TG, triglycerides.
Table 2 summarises the mean changes in lipid levels in the RA and non-RA cohorts. These results are derived from the random-effects models. During the 5 years before the RA incidence/index date, mean TC and LDL levels in the RA cohort decreased significantly (from 5.61 to 5.03 mmol/l and from 3.58 to 2.97 mmol/l, respectively) as compared with the non-RA cohort where the mean TC and LDL levels decreased minimally (table 2). Decreases in TC and LDL levels in the RA cohort (by −0.58 mmol/l and −0.61 mmol/l, respectively) were significantly larger than those in non-RA cohort (p<0.001). The mean changes in lipid levels were otherwise similar in the RA and non-RA cohorts during the study period. Patients with RA experienced a larger decline in TC:HDL ratio than non-RA subjects during the 5 years before RA (table 2).
Mean changes in lipid levels in patients with RA and non-RA subjects from 5 years before to 5 years after the RA incidence/index date based on random effects models
Figure 2 shows the changes in the proportion of patients with RA and non-RA subjects with abnormal lipid measures during the 5 years before and 5 years after the RA incidence/index date. As seen from the figure, the proportion of patients with RA with elevated TC or LDL measures decreased significantly (p<0.001) during the 5 years before RA. No change in the proportion of subjects with abnormal TC or LDL was seen in the non-RA cohort during the corresponding time period. During the 5 years after the RA incidence/index date the proportions of both patients with RA and non-RA subjects with elevated TC and LDL measures remained essentially unchanged. The proportions of patients with RA and non-RA subjects with abnormal HDL and TG measures did not change significantly over the study period (figure 2).

Trends in the proportion of patients with abnormal lipid measures in patients with rheumatoid arthritis (RA) and non-RA subjects during the time period from 5 years before to 5 years after the RA incidence/index date adjusting for age, sex and calendar year of RA diagnosis. HDL, high-density lipoprotein; LDL, low-density lipoprotein; Tch, total cholesterol; TG, triglycerides.
We also examined the potential role of BMI and lipid-lowering drug use on these trends. There were no clinically significant changes in BMI in the RA cohort over the time period (mean BMI 27.7 kg/m2 5 years before RA incidence; 28.4 kg/m2 at RA incidence; 28.4 kg/m2 5 years after RA incidence). Non-RA subjects were more likely to have prescriptions for statins and other lipid-lowering drugs than patients with RA. Among those for whom prescription data were available, 165 (32%) patients with RA and 194 (39%) non-RA subjects had a prescription for statins (p=0.02). Similarly, 174 (34%) patients with RA and 203 (41%) non-RA subjects had a prescription for any lipid-lowering treatment (p=0.02). To explore the impact of statins on the lipid changes we performed a sensitivity analysis excluding statin users. The trends in TC, LDL, HDL and TGs in patients with RA not receiving statins were similar to those reported for the whole RA cohort (data not shown). However, the mean TG levels were considerably lower when statin users were removed, indicating that patients with the higher TG levels were probably taking statins.
To further investigate the nature of lipid changes in RA, we tested the hypothesis that the results would not change if we defined the index date as the date of the first joint swelling. We found that the time from first joint swelling to fulfilment of the fourth criteria for RA was minimal in the majority of patients (median: 4.5 days; 25th centile: 0 days; 75th centile: 108 days). In fact, 73% of patients met criteria within 90 days of the first joint swelling and 80% met within 6 months of the first joint swelling. Sensitivity analyses were performed using the date of the first joint swelling in place of the fourth criteria date as the index date for these analyses, and the results were identical (data not shown).
Discussion
This retrospective cohort study illustrates the longitudinal trends in lipids in a population-based cohort of patients with RA and non-RA subjects from the same underlying community during the period from 5 years before to 5 years after the RA incidence/index date. There was a significant decrease in TC and LDL levels, and a significant decrease in the TC:HDL ratio during the 5-year period before RA incidence. Lipid trends were otherwise similar in the RA and non-RA cohorts during the period from 5 years before to 5 years after RA. During the 5 years before the RA incidence/index date, the proportion of patients with RA with elevated TC or LDL measures was significantly less than for non-RA subjects.
To the best of our knowledge, this is the first longitudinal population-based study reporting long-term lipid trends in RA and non-RA populations both before and after the RA incidence/index date. The major finding of our study is the significant decline in TC and LDL levels occurring during the 5 years before the RA incidence/index date in patients with RA as compared with non-RA subjects. Consistent with the dynamics of TC and HDL changes (ie, decrease in TC levels and unchanged HDL levels), patients with RA also experienced a larger decline in the TC:HDL ratio than non-RA subjects during the 5 years before RA. The declines in TC and LDL levels were similar when using the date of the first joint swelling as an index date.We also found a significant reduction of the proportion of patients with lipid abnormalities (elevated TC or LDL measures) during the 5 years before the incidence/index date in the RA cohort, but not in non-RA subjects.
The only previous longitudinal study describing lipid levels in the pre-RA period was performed using the samples of blood donors in the Netherlands during 1984–99 who later developed RA.19 These authors showed a more atherogenic lipid profile in the preclinical phase of RA. However, owing to differences in study population and design, as well as different time periods under study, these findings cannot be directly compared with ours. The declining trend in TC and LDL levels is concordant with studies showing lower TC and LDL levels in active RA.8 11 This observation is also consistent with the concept of lowering of the plasma cholesterol concentrations in acute (particularly, inflammatory) conditions.20,–,23 In fact, this decrease in TC and LDL levels might result from their increased catabolism or increased retention (ie, subendothelial deposition) rather than decreased lipid production.24 25 Subendothelial lipid deposition might explain the paradox of lower cholesterol levels and increased CV risk in RA. Indeed, low cholesterol concentrations have been previously associated with high mortality risk26 27 and a poor response to tissue stress.28 29
Given that the major declines in TC and LDL occurred during the pre-RA period, even before the first joint swelling, these changes were unlikely to have been affected by antirheumatic treatment. The decreases in TC and LDL levels in RA in our study are unlikely to be solely due to the use of lipid-lowering treatment either, since use of lipid-lowering drugs was lower in RA than in non-RA subjects and the lipid trends in patients with RA were similar when statin users were excluded from the analysis. Hence, the lipid changes in the RA cohort occurring during the 5 years before RA are likely to be associated with the ongoing preclinical inflammation rather than the effect of antirheumatic and lipid-lowering drugs. Lipid changes in non-RA subjects are consistent with the major lipid trends in the US population (studies NHANES and ARIC), suggesting that the non-RA cohort reflects the general population.30 31 These lipid changes can be explained by increasing usage of lipid-lowering drugs in the general population during recent decades.31 A similar explanation might be suggested for the changes in HDL and TG levels in non-RA subjects over time. Although trends in HDL and TG levels in the RA cohort were not significantly different from those in non-RA subjects, the possibility of RA-specific mechanisms for these changes in patients with RA cannot be excluded. However, from this observational study, it is impossible to make inferences about the pathophysiological and clinical implications of lipid profile changes in RA. Thus, the reasons for these lipid changes in the RA population and the association of these trends with excess CV risk in RA are uncertain.
Strengths of the study include the population-based study design and the comprehensive data collection. The unique record linkage system allowed ascertainment of all RA cases from Olmsted County within the study period and provided comprehensive data on RA and non-RA subjects for the study. Our study takes advantage of the longitudinal design and parallel analysis of the lipid trends in patients with RA and the non-RA comparison cohort within the same calendar period.
This study has a number of potential limitations. First, patients with RA may have visited the doctor more often and consequently, may be more likely to have had more lipid measurements than non-RA subjects. Similarly, patients with abnormal lipid values are more likely to have repeat measurements. However, the number of lipid measurements was similar in the RA and non-RA cohorts. Further, this weakness was minimised during the statistical analysis by accounting for multiple lipid measurements per subject. In this observational study, we did not analyse the role of traditional CV risk factors, inflammatory characteristics and antirheumatic drugs in lipid profile changes in RA. The impact of these three potential contributors on the lipid profile in RA was shown previously7 9 19 32,–,34 and is beyond the scope of this study.
While data on lipid-lowering drugs were not available before 1997, this was unlikely to bias the results as the limitation applied equally to both the RA and non-RA cohorts. Although quantitative change in body weight in patients with RA during the study period was not significant, there may have been changes in body composition which were not measured and thus may have been missed. A decrease in muscle mass and an increase in fat mass are common in patients with RA and have been shown to be associated with dyslipidaemia.34,–,36 However, increased, not decreased TC and LDL levels would be expected in patients with RA with rheumatoid cachectic obesity,34 so these metabolic changes are unlikely to explain the observed lipid changes in patients with RA. Finally, during the calendar period of investigation the population of Olmsted County, Minnesota was predominantly white. Thus, the results may not be generalisable to non-white subjects. Except for the higher proportion of the population with higher educational levels, other sociodemographic characteristics of Olmsted County, Minnesota residents are similar to those of US white subjects.
In conclusion, patients with RA experienced a significant decrease in TC and LDL levels during the 5 years before RA incidence as compared with non-RA subjects. Lipid trends were otherwise similar in RA and non-RA cohorts during the 5 years before and 5 years after RA. The prevalence of abnormal TC or LDL measures significantly decreased in the RA, but not in the non-RA cohort, during the 5 years before the RA incidence/index date. These lipid changes in RA are unlikely to be solely due to lipid-lowering treatment or changes in BMI. The reasons and the clinical significance for the apparent changes in lipid profile before RA are uncertain. Further studies of the association of RA characteristics and antirheumatic drugs with lipid profile and CV outcomes in RA over time are underway.
 Stem cells can both self-replicate, as well as produce progenitors that differentiate into other, more mature cell types, such as endothelial cells. Similarly, a cancer stem cell is thought to self-replicate and produce progenitors that generate all of the cell types that make up a tumor.
